SWRA726 March 2022 CC1120 , CC1121 , CC1201 , CC1310 , CC1311P3 , CC1311R3 , CC1312PSIP , CC1312R , CC1312R7 , CC1314R10 , CC1350 , CC1352P , CC1352R , CC1354P10 , CC1354R10 , CC2340R5-Q1 , CC2640R2L , CC2651R3 , CC2652P , CC2652P7 , CC2652R , CC2652R7 , CC2652RB , CC2652RSIP , CC3130 , CC3135MOD , CC3230S , CC3235MODAS , CC3235MODASF , CC3235MODSF , CC3235S , WL1801MOD , WL1805MOD , WL1807MOD , WL1831 , WL1831MOD , WL1835MOD , WL1837MOD
- Trademarks
- 1Introduction
- 2Antenna Standing Wave Ratio (SWR) Measurement
- 3Evaluation Board Matching Components Location
- 4Volpert-Smith Chart
- 5868-MHz PCB Helix Antenna Measurement and Matching
- 62.4-GHz PCB Compact Antenna Measurement and Matching
- 7 2.4-GHz PCB Inverted-F Antenna Measurement and Matching
- 8Fast in-circuit or in-device Antenna Verification
- 9Conclusion
4 Volpert-Smith Chart
A main goal of antenna's impedance matching is compensating for capacitive or inductive reactance and transforming the impedance as close to an active 50-Ohm value as possible.
In the past, such calculations were done thru S (Scattering) parameters matrix (S11 is a parameter for an antenna). It was a very complex job, but in 40s of XX century, two independent engineers A. Volpert and Ph. Smith designed graphical charts for plotting impedances (or complex reflections) values in a visible R ± jX format. Most modern vector network analyzers represent the impedance in this type of chart.
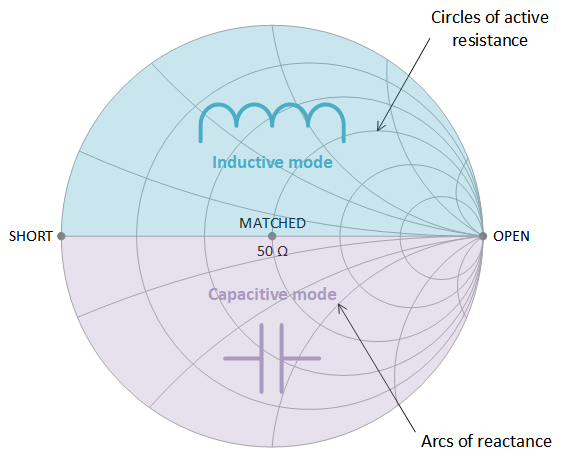
A simplified chart is shown in the Figure 4-1. It’s a chart with circles and arcs. Circles represent an active resistance, arcs represent an inductive or capacitive reactance. Depending on where the measurement result is, users can visibly see what mode of impedance of the antenna is under test.
 Figure 4-1 Simplified Volpert - Smith
chart
Figure 4-1 Simplified Volpert - Smith
chartThe center of the chart is a totally matched impedance of 50 Ohm (it also can be 75 or 100 Ohm depending on what type of impedance users need) without any reactance. A horizontal axis thru the center of the chart shows an active resistance value from a short circuit (on the left) to open circuit (on the right). Top and bottom parts of the chart represent an inductive or capacitive reactance. Ideally, values should reach the center of chart and minimize or cancel the inductive or capacitive reactance.
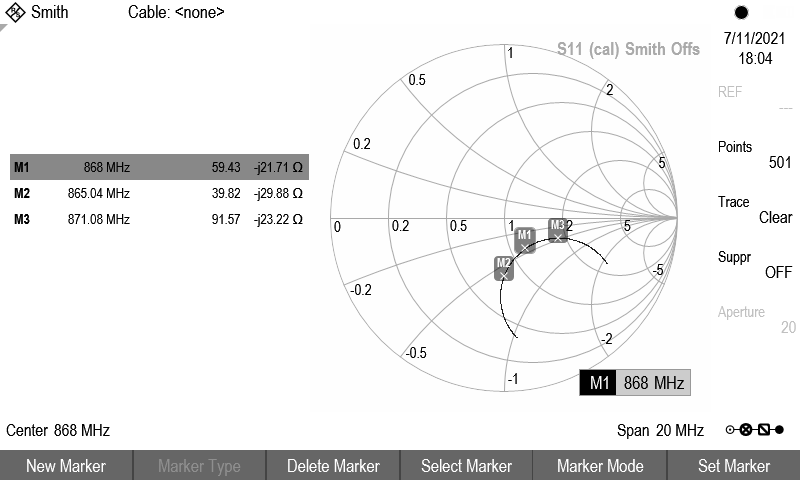
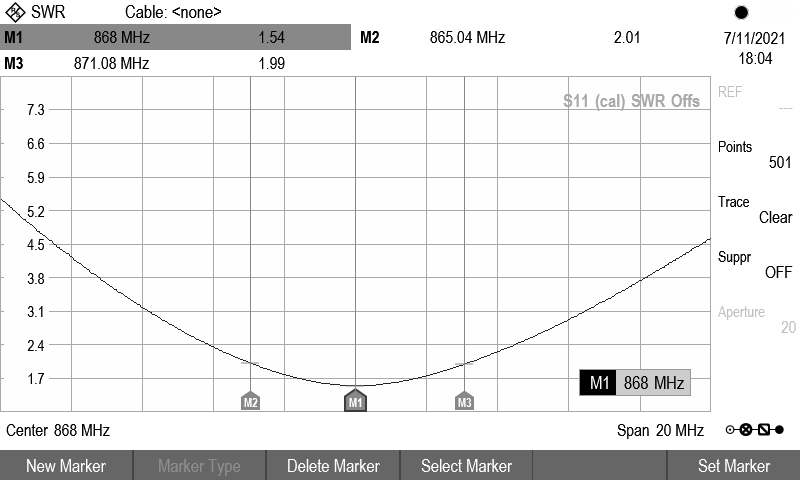
Let’s have a look at example of impedance of a real 868-MHz band antenna shown in the Figure 4-2. Measurements made at three specific frequencies. Two of them at SWR level of 2.0:1 and one directly at 868 MHz ( at frequency of interest). An impedance at this frequency is 59 – j21.71 Ohm and has a capacitive mode, as it is placed on the bottom of the chart. This specific antenna has the capacitive mode at all operation frequencies. Another type of antenna can have only an inductive or both modes.
The idea of this examples is to show how the impedance changes versus the operation frequency in a span of 20 MHz and correlates with SWR level.
 Figure 4-2 Measured Antenna’s Impedance
Example
Figure 4-2 Measured Antenna’s Impedance
ExampleUsers can see marker M1 (at 868 MHz) has the shortest distance to the center of the chart with the lowest SWR value of 1.54:1 (Figure 4-3).
 Figure 4-3 Measured and Corresponded SWR
Levels