SPRUIK4A September 2018 – June 2019 F28377D-SEP , TMS320F280021 , TMS320F280021-Q1 , TMS320F280023 , TMS320F280023-Q1 , TMS320F280023C , TMS320F280025 , TMS320F280025-Q1 , TMS320F280025C , TMS320F280025C-Q1 , TMS320F280040-Q1 , TMS320F280040C-Q1 , TMS320F280041 , TMS320F280041-Q1 , TMS320F280041C , TMS320F280041C-Q1 , TMS320F280045 , TMS320F280048-Q1 , TMS320F280048C-Q1 , TMS320F280049 , TMS320F280049-Q1 , TMS320F280049C , TMS320F280049C-Q1 , TMS320F28075 , TMS320F28075-Q1 , TMS320F28076 , TMS320F28374D , TMS320F28374S , TMS320F28375D , TMS320F28375S , TMS320F28375S-Q1 , TMS320F28376D , TMS320F28376S , TMS320F28377D , TMS320F28377D-Q1 , TMS320F28377S , TMS320F28377S-Q1 , TMS320F28378D , TMS320F28378S , TMS320F28379D , TMS320F28379D-Q1 , TMS320F28379S
-
C2000 Software Frequency Response Analyzer (SFRA) Library and Compensation Designer in SDK Framework
- Trademarks
- 1 Introduction
- 2 Installing the SFRA Library
- 3 Module Summary
- 4 Compensation Designer
- 5 Case Study
- 6 Running Software Test Bench Example for SFRA
- 7 Using SFRA Without SFRA GUI Integration
- 8 FAQ
- Revision History
1 Introduction
Texas Instruments' software frequency response analyzer (SFRA) library is designed to enable frequency response analysis on digitally controlled power converters using software only and without the need for an external frequency response analyzer. The optimized library can be used in high frequency power conversion applications to identify the plant, the closed loop and the open loop gain characteristics of a closed loop power converter, which can be used to get stability information such as gain margin, phase margin and open loop gain crossover frequency, to evaluate the control loop performance.
NOTE
This documentation pertains to the SFRA Library released in the C2000WARE-DIGITALPOWER-SDK framework. At the time of authoring of this document, only the single precision floating point format of the library is available inside the SDK framework, the fixed-point version is not yet ported to the new software framework. For the fixed-point version of the library, see controlSUITE and the C2000™ Software Frequency Response Analyzer (SFRA) Library and Compensation Designer User's Guide.
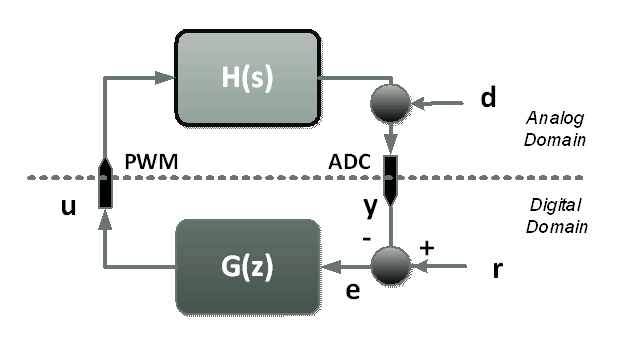
Consider a digitally controlled closed loop power converter, as shown in Figure 1, where:
- H is the transfer function of the plant that needs to be controlled
- G is the digital compensator
- GH is referred to as the open loop transfer function
- CL is refrerred to as the closed loop transfer function and is GH/(1+GH)
- r is the instantaneous set point or the reference of the converter
- Ref is the DC set point reference
- y the analog-to-digital converter (ADC) feedback
- e the instantaneous error
- d the sensor noise and disturbance
- u the PWM duty cycle
The key objectives of the compensator in a closed loop system can be summarized as:
- Ensure that the system is stable (for example, the system tracks the reference asymptotically)
- System provides disturbance rejection to ensure robust operation


 Figure 1. Digitally Controlled Power Converter
 Whether or not the system meets the objectives can be determined by knowing the open loop transfer function (GH), as shown in Equation 1 and Equation 2.
A Bode plot of the open loop transfer function GH is frequently used for this purpose and quantities such as gain margin (GM), phase margin (PM) and open loop gain crossover frequency (Folg_cf) are often used to comment on the stability and robustness of a closed loop power converter.
The closed loop transfer function (GH/(1+GH)) provides an idea of the tracking that is how good the system is able to track to the reference commanded.
The SFRA library can enable measurements of the GH, GH/(1+GH) and H frequency response by software. This data can be used to:
- Verify the plant model (H) or extract the plant model (H)
- Design a compensator (G) for the closed loop plant
- Verify the close loop performance of the system by plotting the open loop (GH) or Closed Loop (GH/(1+GH)) Bode diagram
As the frequency response of GH and H carry information of the plant, the data can be used to comment on the health of the power stage by periodically measuring the frequency response.
The SFRA library is based on sinusoidal injection principle, where the assumption is that the injection amplitude causes very small deviation to the normal operating point of the converter. The SFRA library can be integrated into the control code of the power converter, this document details the steps to do so. All computations for the GH, H and CL calculations are done on the MCU and the entire arrays of the GH, H and CL magnitude and phase response are stored on the controller. For visualization purpose, a GUI is also provided with the tool. This GUI can be used to start a frequency response sweep, observer progress of the SFRA sweep and analyze the GH, H and CL plots generated after the FRA sweeps.
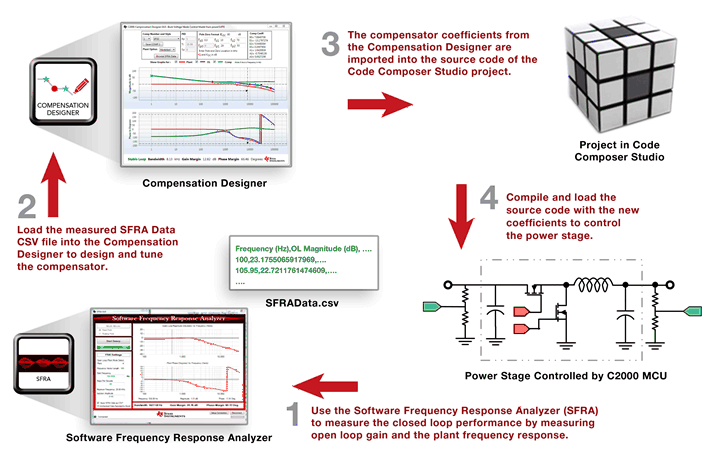
Once integrated into the code, the SFRA library can be used to design or fine tune the controller. For this, a typical flow of using SFRA library is:
- Initiate a SFRA sweep in open loop through the SFRA GUI that populates the data in a comma separate value (CSV) file, stored at the location where SFRA GUI is invoked from. This information can then be used to identify the plant model for the steady state operating point at which the SFRA sweep has been conducted.
- This SFRA CSV data can directly be used in the Compensation Designer to design a compensator that meets the system requirements. (Alternatively, if the Excel file option was used from the GUI, the MATLAB script provided with this package can be used to read that data into MATLAB and then curve fit the response to a transfer function. Sisotool can then be used to design the compensator).
- New Compensator values can be copied from the compensation designer GUI or MATLAB into the Code Composer Studio™ project.
- Compile and load the code with new coefficients into the microcontroller controlling the power stage. SFRA algorithm (Step 1) can be re-run to verify the closed loop system performance by measuring the open loop gain GH (also referred to as loop gain in many literatures).
NOTE
Optionally, the SFRA GUI can output data to an excel file.
In summary, TI’s software frequency response analyzer along with the Compensation Designer provides a methodology to tune power supplies in a systematic way and enables quick and easy frequency response analysis for power converters without the need of external connections and equipment, as shown in Figure 2. Since no external connections are used, the SFRA can be run repeatedly to periodically assess the health of the power converter and get diagnostic information.
 Figure 2. Control Design Using SFRA Library and Compensation Designer