SPRAD28 October   2022 AM2431 , AM2432 , AM2434 , AM2631 , AM2631-Q1 , AM2632 , AM2632-Q1 , AM2634 , AM2634-Q1 , AM26C31 , AM26C31-EP , AM26C31C , AM26C31I , AM26C31M , AM26C32 , AM26C32-EP , AM26C32C , AM26C32M , AM26LS31 , AM26LS31M , AM26LS32A , AM26LS32AC , AM26LS32AM , AM26LS33A , AM26LS33A-SP , AM26LS33AM , AM26LV31 , AM26LV31E , AM26LV31E-EP , AM26LV32 , AM26LV32E , AM26LV32E-EP , AM26S10 , AM2732 , AM2732-Q1


  1.   Abstract
  2.   Trademarks
  3. Building for Debug
    1. 1.1 Disable Code Optimization
    2. 1.2 Using the Debug SDK Libraries
  4. Code Composer Studio Stop-Mode Debugging
    1. 2.1 Configuring the Debugger
    2. 2.2 Breakpoints and Watchpoints
      1. 2.2.1 Software Breakpoints
      2. 2.2.2 Hardware Breakpoints
      3. 2.2.3 Watchpoints
    3. 2.3 Inspecting Device Registers
    4. 2.4 Inspecting Disassembly
  5. Debug Logging
    1. 3.1 Logging Methods
    2. 3.2 Log Zones
    3. 3.3 Asserts
    4. 3.4 Example Usage
  6. Multi-Core Debug
    1. 4.1 Grouping Cores
      1. 4.1.1 Fixed Group
      2. 4.1.2 Hiding Cores
    2. 4.2 Using Multiple Workbench Windows
    3. 4.3 Global Breakpoints
  7. Debugging Arm Cortex-R5 Exceptions
    1. 5.1 Exception Priority Order
    2. 5.2 Aborts
      1. 5.2.1 Data Aborts
        1. 5.2.1.1 Alignment
        2. 5.2.1.2 Background Aborts
        3. 5.2.1.3 Permission
        4. 5.2.1.4 Synchronous/Asynchronous External
        5. 5.2.1.5 Synchronous/Asynchronous ECC
      2. 5.2.2 Synchronous/Asynchronous Aborts
        1. 5.2.2.1 Changing an Asynchronous Abort to a Synchronous Abort
        2. 5.2.2.2 Synchronous Abort
        3. 5.2.2.3 Asynchronous Abort
        4. 5.2.2.4 Debugging Asynchronous Abort
      3. 5.2.3 Prefetch Abort
        1. 5.2.3.1 Possible Reasons for Prefetch Abort
        2. 5.2.3.2 Handling Prefetch Abort Exception
      4. 5.2.4 Undefined Instruction
        1. 5.2.4.1 Possible Reasons for Undefined Instruction Exception
        2. 5.2.4.2 Handling Undefined Instruction Exception
    3. 5.3 Fetching Core Registers Inside an Abort Handler
  8. Debugging Arm Cortex-M4 Exceptions
    1. 6.1 Exception Entry and Exit Sequence
      1. 6.1.1 Entry Sequence
      2. 6.1.2 Exception Exit Sequence
      3. 6.1.3 Decoding EXC_RETURN Value
    2. 6.2 Faults Handling
      1. 6.2.1 There are 15 System Exceptions by Arm Cortex M Processors
        1. 6.2.1.1 Causes of Faults
      2. 6.2.2 HardFault Exception
        1. 6.2.2.1 Causes of HardFault Exception
      3. 6.2.3 Configurable Fault Exceptions
        1. 6.2.3.1 Mem Manage Fault Exception
        2. 6.2.3.2 BusFault Exception
        3. 6.2.3.3 Usage Fault Exception
      4. 6.2.4 Control Registers
        1. 6.2.4.1 SHP - System Handler Priority Register
      5. 6.2.5 Status Registers
        1. 6.2.5.1 Undefined Instruction Handling Example
        2. 6.2.5.2 Invalid State Handling Example
      6. 6.2.6 Printing the Stack Frame
  9. Debugging Memory
    1. 7.1 Viewing Device Memory
    2. 7.2 Linker Command File (linker.cmd)
      1. 7.2.1 The Memory Directive
      2. 7.2.2 The Sections Directive
    3. 7.3 Stack Overflow
      1. 7.3.1 -fstack-protector
      2. 7.3.2 -fstack-protector-strong
      3. 7.3.3 -fstack-protector-all
      4. 7.3.4 Enabling Stack Smashing Detection
      5. 7.3.5 Enabling Stack Smashing Detection
    4. 7.4 Variables and Expressions View in CCS
    5. 7.5 Understanding Your Application's Memory Allocation
    6. 7.6 FreeRTOS ROV
  10. Debugging Boot
    1. 8.1 ROM Boot
    2. 8.2 SBL Boot
    3. 8.3 GEL Files
      1. 8.3.1 Debugging Init Code
        1. 8.3.1.1 Disable Auto-Run to Main
  11. Debugging Real-Time Control Loops
    1. 9.1 Trace
      1. 9.1.1 Processor / Core Trace
      2. 9.1.2 How to Use CCS to Capture Trace Data on an AM243x
    2. 9.2 Code Profile / Coverage
      1. 9.2.1 CCS Count Event
    3. 9.3 Real-Time UART Monitor
      1. 9.3.1 Confirm CCS Features
      2. 9.3.2 Create Target Configuration File
      3. 9.3.3 Add Serial Command Monitor Software
      4. 9.3.4 Launch Real Time Debug
  12. 10E2E Support Forums

How to Use CCS to Capture Trace Data on an AM243x

When having a debug session started for launchpad, the target is connected to CCS and GPIO led blink example for the R5 core is loaded and halted at main.

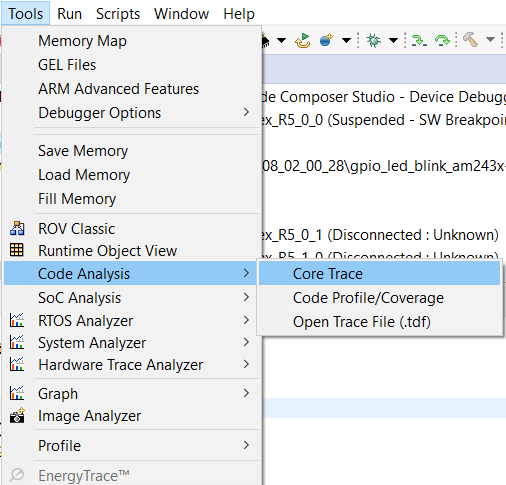
Under the tools → code analysis.

Select the first option (Core Trace) to capture core trace data, which is real-time gathering of instructions being executed by the core.

GUID-20220327-SS0I-D0CF-4KPM-FTSC5RLF4W2S-low.png

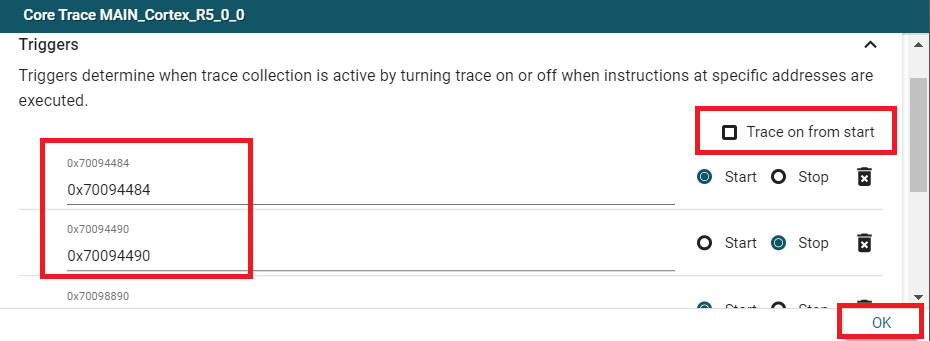
In the core trace tab, there are several options available. Filters are used to include or exclude trace data from specific address ranges. Triggers determine when trace collection is active by turning trace on or off instructions that specific addresses are executed.

Receiver settings allow you to specify the trace receiver to be used to specify the bugger type and specify if trace collection should be synchronized with the target execution. ETB is the only receiver option available for this launchpad (leave the rest of the options as default). Due to the small size of the ETB, it's not possible to capture core trace data for the entire application. Hence, you need to use triggers to enable and disable trace collection at specific addresses. This allows us to only capture the trace data that you are interested without risk of losing any data if the buffer wraps around. Our goal is to enable trace collection only around the part of the toggles the GPIO pin that toggles the LED. You can found those addresses by setting breakpoints and look at the Dissasembly of the breakpoints. Set start and stop addresess, and uncheck the "Trace on from start" option:

GUID-20220327-SS0I-KWDH-BZHS-R0XHR4Q54LSG-low.png

Hit on "Ok" and run the program (you can see that the program is running successfully since the led is blinking). Once the program has finished running and the target is halted at the exit point, the captured data in the ETB is sent to CCS and displayed in the core trace view. There you can see the data for each dace entry, data such as program address, the associated opcode and so on.