SPRAD28 October   2022 AM2431 , AM2432 , AM2434 , AM2631 , AM2631-Q1 , AM2632 , AM2632-Q1 , AM2634 , AM2634-Q1 , AM26C31 , AM26C31-EP , AM26C31C , AM26C31I , AM26C31M , AM26C32 , AM26C32-EP , AM26C32C , AM26C32M , AM26LS31 , AM26LS31M , AM26LS32A , AM26LS32AC , AM26LS32AM , AM26LS33A , AM26LS33A-SP , AM26LS33AM , AM26LV31 , AM26LV31E , AM26LV31E-EP , AM26LV32 , AM26LV32E , AM26LV32E-EP , AM26S10 , AM2732 , AM2732-Q1


  1.   Abstract
  2.   Trademarks
  3. Building for Debug
    1. 1.1 Disable Code Optimization
    2. 1.2 Using the Debug SDK Libraries
  4. Code Composer Studio Stop-Mode Debugging
    1. 2.1 Configuring the Debugger
    2. 2.2 Breakpoints and Watchpoints
      1. 2.2.1 Software Breakpoints
      2. 2.2.2 Hardware Breakpoints
      3. 2.2.3 Watchpoints
    3. 2.3 Inspecting Device Registers
    4. 2.4 Inspecting Disassembly
  5. Debug Logging
    1. 3.1 Logging Methods
    2. 3.2 Log Zones
    3. 3.3 Asserts
    4. 3.4 Example Usage
  6. Multi-Core Debug
    1. 4.1 Grouping Cores
      1. 4.1.1 Fixed Group
      2. 4.1.2 Hiding Cores
    2. 4.2 Using Multiple Workbench Windows
    3. 4.3 Global Breakpoints
  7. Debugging Arm Cortex-R5 Exceptions
    1. 5.1 Exception Priority Order
    2. 5.2 Aborts
      1. 5.2.1 Data Aborts
        1. 5.2.1.1 Alignment
        2. 5.2.1.2 Background Aborts
        3. 5.2.1.3 Permission
        4. 5.2.1.4 Synchronous/Asynchronous External
        5. 5.2.1.5 Synchronous/Asynchronous ECC
      2. 5.2.2 Synchronous/Asynchronous Aborts
        1. 5.2.2.1 Changing an Asynchronous Abort to a Synchronous Abort
        2. 5.2.2.2 Synchronous Abort
        3. 5.2.2.3 Asynchronous Abort
        4. 5.2.2.4 Debugging Asynchronous Abort
      3. 5.2.3 Prefetch Abort
        1. 5.2.3.1 Possible Reasons for Prefetch Abort
        2. 5.2.3.2 Handling Prefetch Abort Exception
      4. 5.2.4 Undefined Instruction
        1. 5.2.4.1 Possible Reasons for Undefined Instruction Exception
        2. 5.2.4.2 Handling Undefined Instruction Exception
    3. 5.3 Fetching Core Registers Inside an Abort Handler
  8. Debugging Arm Cortex-M4 Exceptions
    1. 6.1 Exception Entry and Exit Sequence
      1. 6.1.1 Entry Sequence
      2. 6.1.2 Exception Exit Sequence
      3. 6.1.3 Decoding EXC_RETURN Value
    2. 6.2 Faults Handling
      1. 6.2.1 There are 15 System Exceptions by Arm Cortex M Processors
        1. 6.2.1.1 Causes of Faults
      2. 6.2.2 HardFault Exception
        1. 6.2.2.1 Causes of HardFault Exception
      3. 6.2.3 Configurable Fault Exceptions
        1. 6.2.3.1 Mem Manage Fault Exception
        2. 6.2.3.2 BusFault Exception
        3. 6.2.3.3 Usage Fault Exception
      4. 6.2.4 Control Registers
        1. 6.2.4.1 SHP - System Handler Priority Register
      5. 6.2.5 Status Registers
        1. 6.2.5.1 Undefined Instruction Handling Example
        2. 6.2.5.2 Invalid State Handling Example
      6. 6.2.6 Printing the Stack Frame
  9. Debugging Memory
    1. 7.1 Viewing Device Memory
    2. 7.2 Linker Command File (linker.cmd)
      1. 7.2.1 The Memory Directive
      2. 7.2.2 The Sections Directive
    3. 7.3 Stack Overflow
      1. 7.3.1 -fstack-protector
      2. 7.3.2 -fstack-protector-strong
      3. 7.3.3 -fstack-protector-all
      4. 7.3.4 Enabling Stack Smashing Detection
      5. 7.3.5 Enabling Stack Smashing Detection
    4. 7.4 Variables and Expressions View in CCS
    5. 7.5 Understanding Your Application's Memory Allocation
    6. 7.6 FreeRTOS ROV
  10. Debugging Boot
    1. 8.1 ROM Boot
    2. 8.2 SBL Boot
    3. 8.3 GEL Files
      1. 8.3.1 Debugging Init Code
        1. 8.3.1.1 Disable Auto-Run to Main
  11. Debugging Real-Time Control Loops
    1. 9.1 Trace
      1. 9.1.1 Processor / Core Trace
      2. 9.1.2 How to Use CCS to Capture Trace Data on an AM243x
    2. 9.2 Code Profile / Coverage
      1. 9.2.1 CCS Count Event
    3. 9.3 Real-Time UART Monitor
      1. 9.3.1 Confirm CCS Features
      2. 9.3.2 Create Target Configuration File
      3. 9.3.3 Add Serial Command Monitor Software
      4. 9.3.4 Launch Real Time Debug
  12. 10E2E Support Forums

FreeRTOS ROV

The Runtime Object View (ROV) provides tools that enable developers to quickly visualize the state of embedded applications. ROV reads memory from the target and intelligently displays data.

  • ROV does not disturb the run-time behavior of the application on the target (when using a JTAG connection). ROV can read current memory from a running target. ROV also automatically refreshes all of its views whenever the target is stopped–for example when single stepping, when the target hits a breakpoint, or when you halt the target asynchronously.
  • ROV adds zero footprint to the target code (when using a JTAG connection).
  • ROV provides visual tools that show changes in the target state, memory use, and data structures on the host computer. The tool shows high-level information needed by embedded application developers.
  • ROV is provided automatically with the TI-RTOS Kernel component of the Sitara SDK. If you use Code Composer Studio (CCS) you have an access to ROV. Nothing needs to be enabled in the application code.

ROV can be extended to work with any embedded library. The examples on this page use the TI-RTOS Kernel, which includes ROV support for its entities including threads, heap memory, and CPU load.

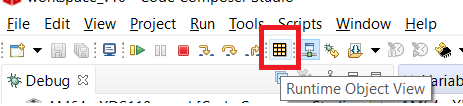
  1. To launch ROV views, click on the “ROV” button in the CCS toolbar as shown below:
    GUID-20220323-SS0I-FLHQ-DTZM-1T1LMPMGHNTS-low.png
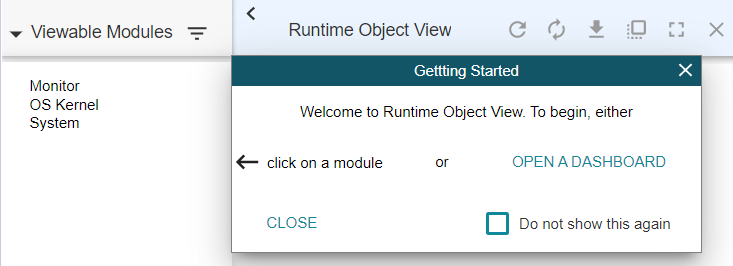
  2. Click on various “Viewable Modules”. “OS Kernel” is the one which has useful views:
    GUID-20220323-SS0I-ZFTP-ZRPD-XTWZLXPCSP4S-low.png
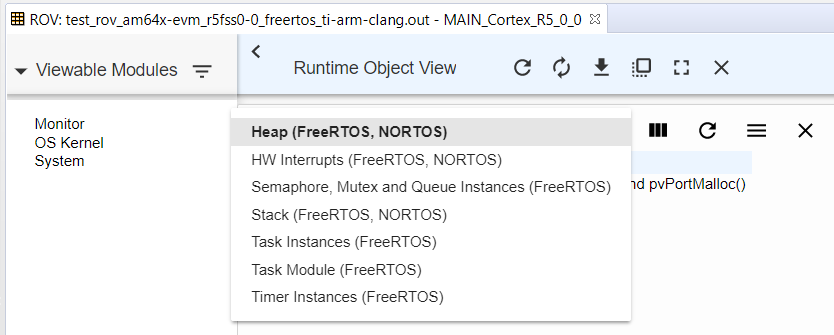
  3. After clicking on "OS Kernel", click on the drop down to see all the supported ROV views:
    GUID-20220323-SS0I-HTDM-VJSR-74PGGPX0QKQP-low.png
  4. Shown below is a sample after "Task Instances" view is selected.
    GUID-20220323-SS0I-VXQ4-L3RB-PNZ93HK15RWH-low.png

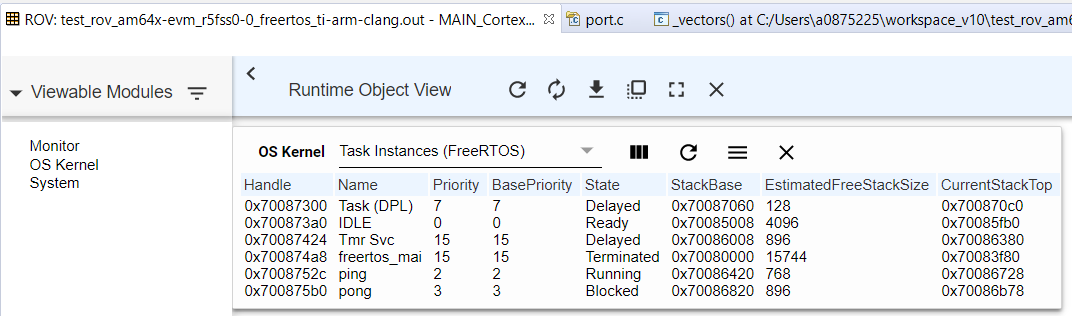
The ROV can be very helpful for debugging stack overflow issues. When an error such as a stack overflow occurs, the corresponding field is highlighted in red. Hover your cursor over a red field to see a brief description of the error.