SBAU171D May 2010 – January 2016 ADS1198 , ADS1298
-
ADS1298ECG-FE/ADS1198ECG-FE
- Trademarks
- 1 ADS1298ECG-FE/ADS1198ECG-FE Overview
- 2 Quick Start
- 3
Using the ADS1298ECG-FE Software
- 3.1 Application User Menu
- 3.2 Top-Level Application Controls
- 3.3 About Tab
- 3.4 ADC Register Tab
- 3.5 Analysis Tab
- 3.6 Save Tab
- 4 ADS1x98ECG-FE Input Signals
- 5 ADS1298ECG-FE/ADS1198ECG-FE Hardware Details
- ASchematics, BOM, Layout, and ECG Cable Details
- BExternal Optional Hardware
- CSoftware Installation
3.5.3 FFT Tab
The FFT tool allows the user to examine the channel-specific spectrum as well as typical figures of merit such as SNR, THD, ENOB, and CMRR. Each feature is numbered below and described in detail in the following subsections. Figure 22 illustrates an FFT plot for a normal electrode configuration.
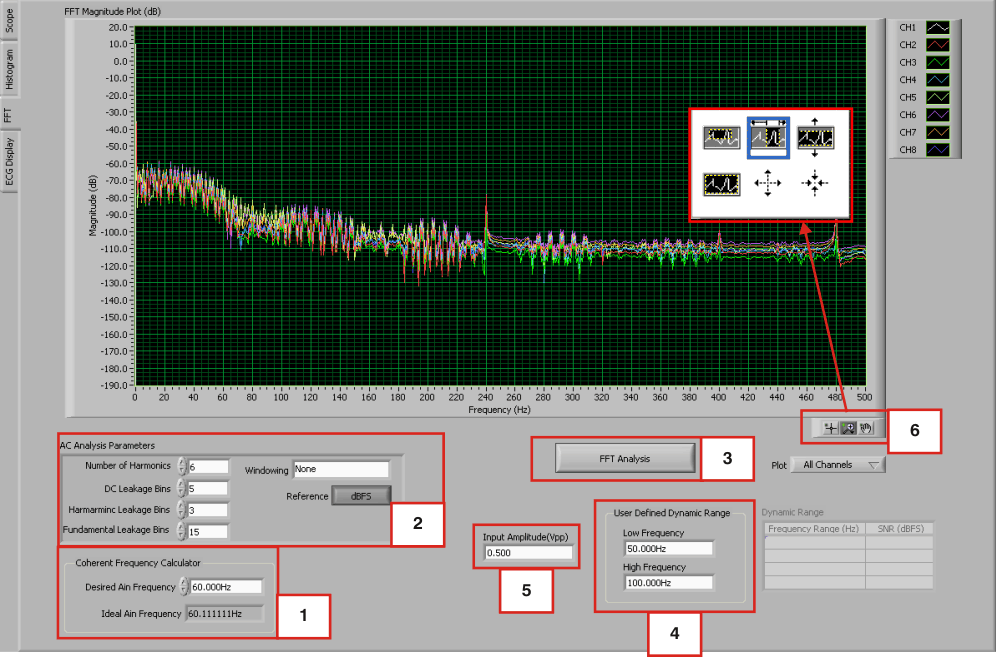 Figure 22. FFT Graph of Normal Electrode Configuration
 1 - Coherent Frequency Calculator
Coherent sampling in an FFT is defined as FAIN/FSAMPLE = NWINDOW/NTOTAL, where:
- FAIN is the input frequency
- FSAMPLE is the sampling frequency of the ADS1298
- NWINDOW is the number of odd integer cycles during a given sampling period
- NTOTAL is the number of data points (in powers of 2) that is used to create the FFT
If the conditions for coherent sampling can be met, the FFT results for a periodic signal will be optimized. The Ideal AIN Frequency is a value that is calculated based on the sampling rate, such that the coherent sampling criteria can be met.
2 - AC Analysis Parameters
This section of the tool allows the user to dictate the number of harmonics, DC leakage bins, harmonic leakage bins, and fundamental leakage bins that are used in the creation of various histograms. Pressing the Windowing button, illustrated in Figure 23, allows the user to evaluate the FFT graph under a variety of different windows. Note that pressing the Reference button toggles between dBFS (decibels, full-scale) and dBc (decibels to carrier).
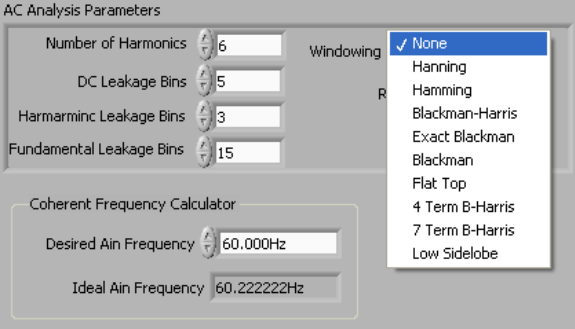 Figure 23. AC Analysis Parameters: Windowing Options
 3 - FFT Analysis
Pressing the FFT Analysis button pulls up the FFT Analysis window shown in Figure 24. This window provides calculated parameters obtained from the collected data that may be useful during evaluation. One of the values included in this analysis is the channel-to-channel noise.
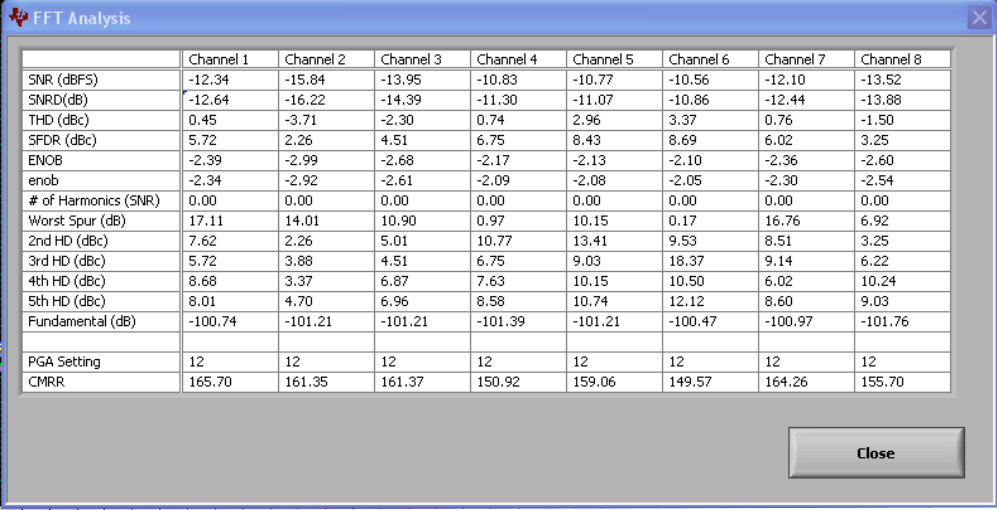 Figure 24. FFT Analysis: Input Short Condition
 4 - User-Defined Dynamic Range
This section enables the user to examine the SNR of a specific channel within a given frequency band defined by Low Frequency and High Frequency. The SNR displayed in this window shows under the Dynamic Range heading as Figure 25 illustrates.
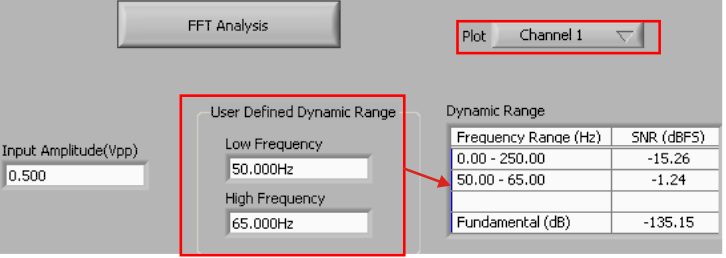 Figure 25. Changing the User-Defined Dynamic Range for Channel 1
 5 - Input Amplitude
This field is a user input that is important for accurately calculating the CMRR of each channel.
6 - Zoom Tool
As with the Analysis, Histogram, and Scope tool, this zoom function allows a closer examination of the FFT at frequencies of interest, as shown in Figure 26.
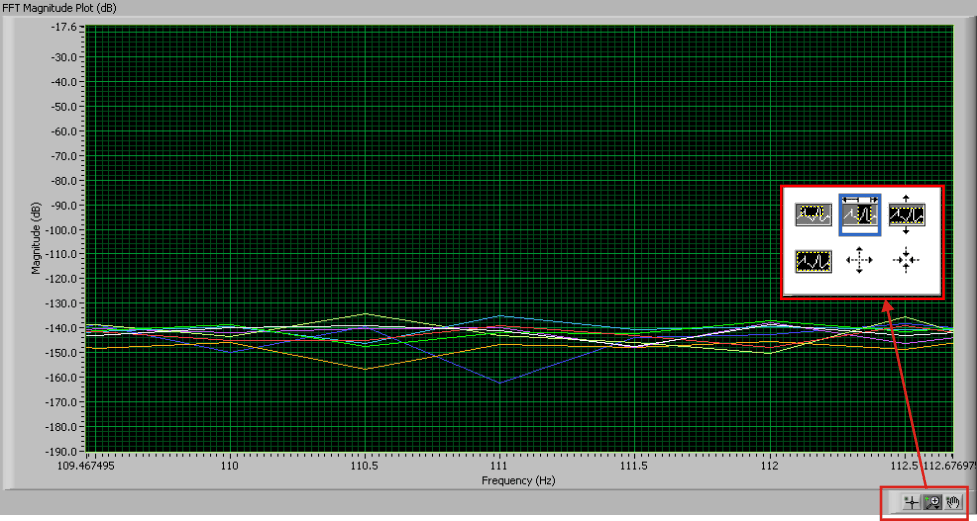 Figure 26. FFT Plot Using Zoom Tool