TIDUEM7A April 2019 – February 2021
- Description
- Resources
- Features
- Applications
- 5
- 1System Description
-
2System Overview
- 2.1 Block Diagram
- 2.2 Highlighted Products
- 2.3 Design Considerations
- 2.4
Hardware, Software, Testing Requirements, and Test Results
- 2.4.1 Required Hardware and Software
- 2.4.2
Testing and Results
- 2.4.2.1 Test Setup
- 2.4.2.2 Test Results
- 3Design Files
- 4Related Documentation
- 5About the Author
- 6Revision History
To view the metrology parameter values from the GUI, perform the following steps:
- Select whether to use the RS-485 or RS-232 connection for communication to the PC GUI. This selection is done by placing 3 jumpers on jumper headers J16, J17, and J18. To select the RS-485 communication option, put the jumpers on the top two leftmost pins (labeled RS-485 on the board) of these three headers. To select the RS-232 communication option, put the jumpers on the two rightmost pins (labeled RS-232 on the board) of the three headers.
- Connect the reference design to a PC
- RS-232 option: Connect the reference design to a PC using a RS-232 cable. If the PC does not have a RS-232 adapter, use a serial RS-232 adapter. The RS-232 adapter should create a COM port on the PC when it is plugged in.
- RS-485 option: Use a USB to RS-485 adapter to communicate between the PC GUI and the RS-485 port on this design. The USB to RS-485 adapter should create a COM port on the PC when it is plugged in. The other end of the adapter should have wires for the RS-485 Data A and Data B connections as well as a GND connection and a 5-V power connection., Connect all these wires to the J21 screw terminal block of the design according to the connection labels next to the terminal block pins. For testing this circuit, the following USB to RS-485 adapter is specifically used: http://www.ftdichip.com/Support/Documents/DataSheets/Cables/DS_USB_RS485_CABLES.pdf. For this specific adapter, the Data A connection is orange, the Data B connection wire is yellow, the GND connection is black, and the 5-V power connection is red.
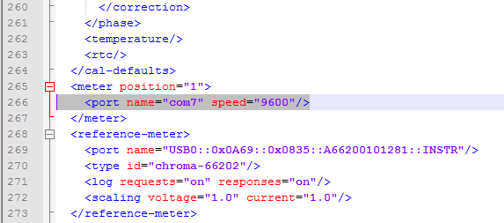
- Open the GUI folder and open calibration-config.xml in a text editor.
- Change the port name field within the meter tag to the COM port connected to the system. As Figure 2-30 shows, this field is changed to COM7.
 Figure 2-30 GUI Configuration File Changed to Communicate With Energy Measurement System
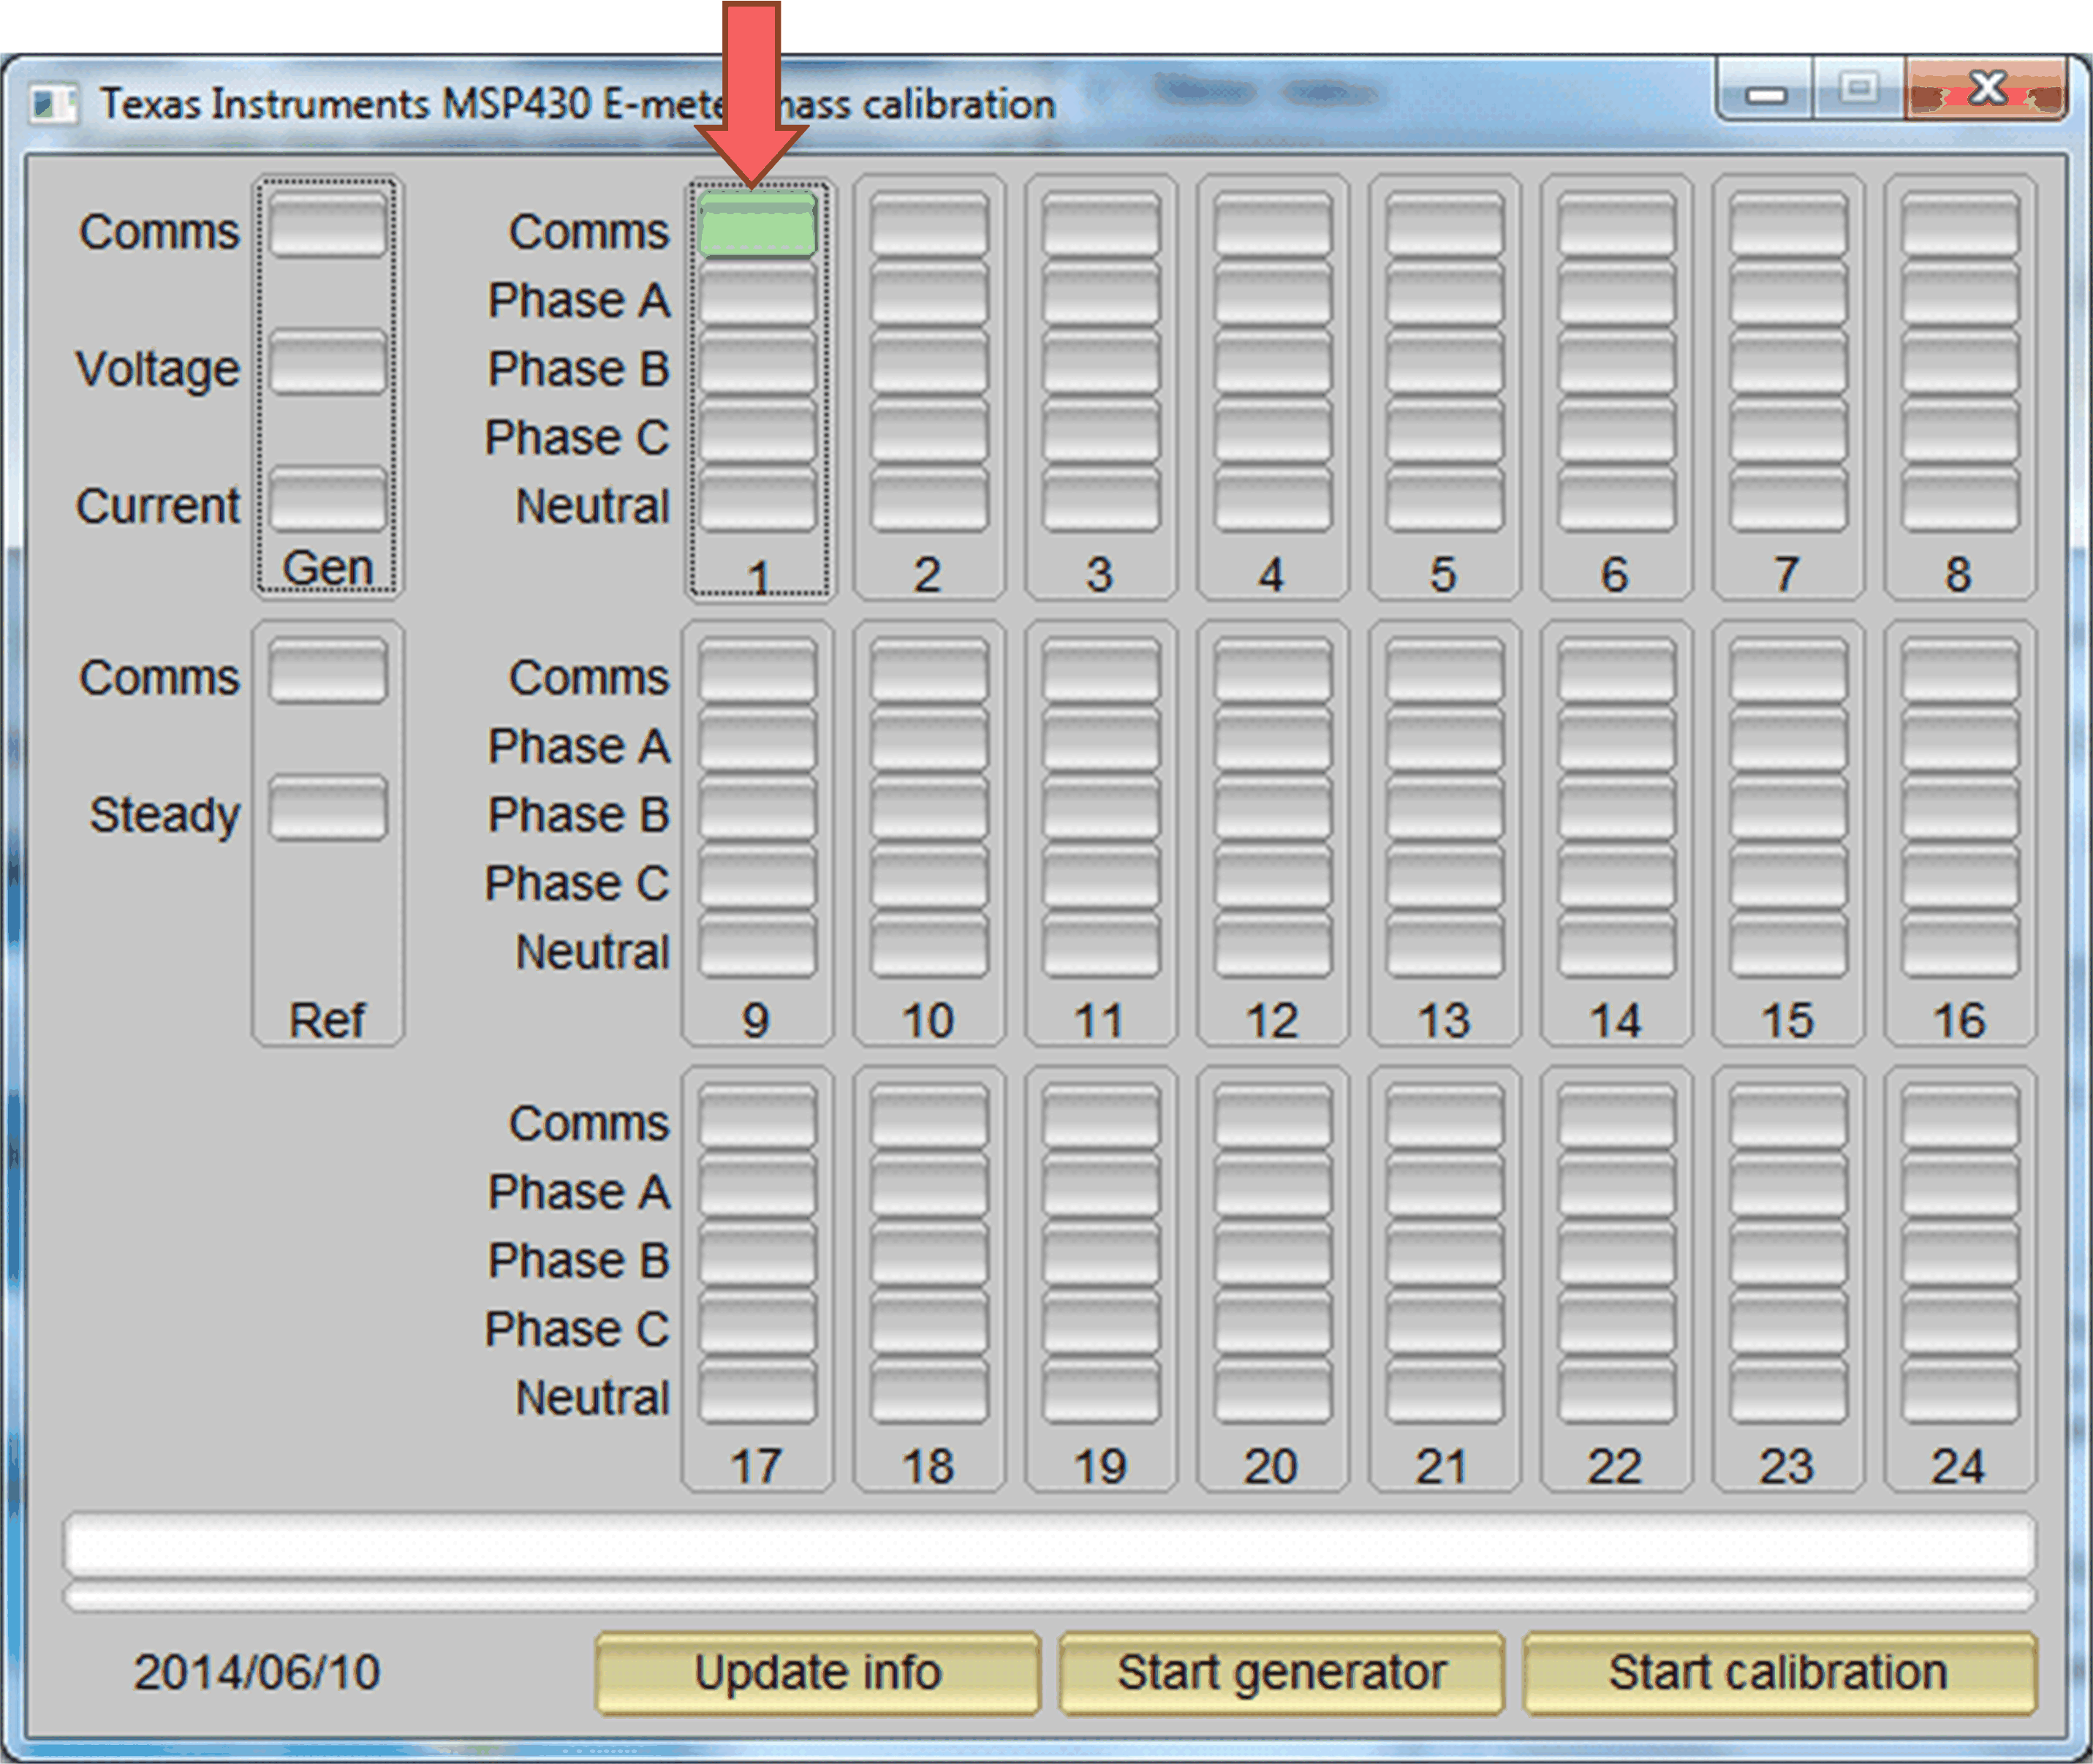
 - Run the calibrator.exe file, which is located in the GUI folder. If the COM port in the
calibration-config.xml was changed in the previous step to the COM port connected to the reference design, the GUI opens (see Figure 2-31). If the GUI connects to the design properly, the top-left button is green. If there are problems with connections or if the code is not configured correctly, the button is red. Click the green button to view the results. Figure 2-31 GUI Startup Window
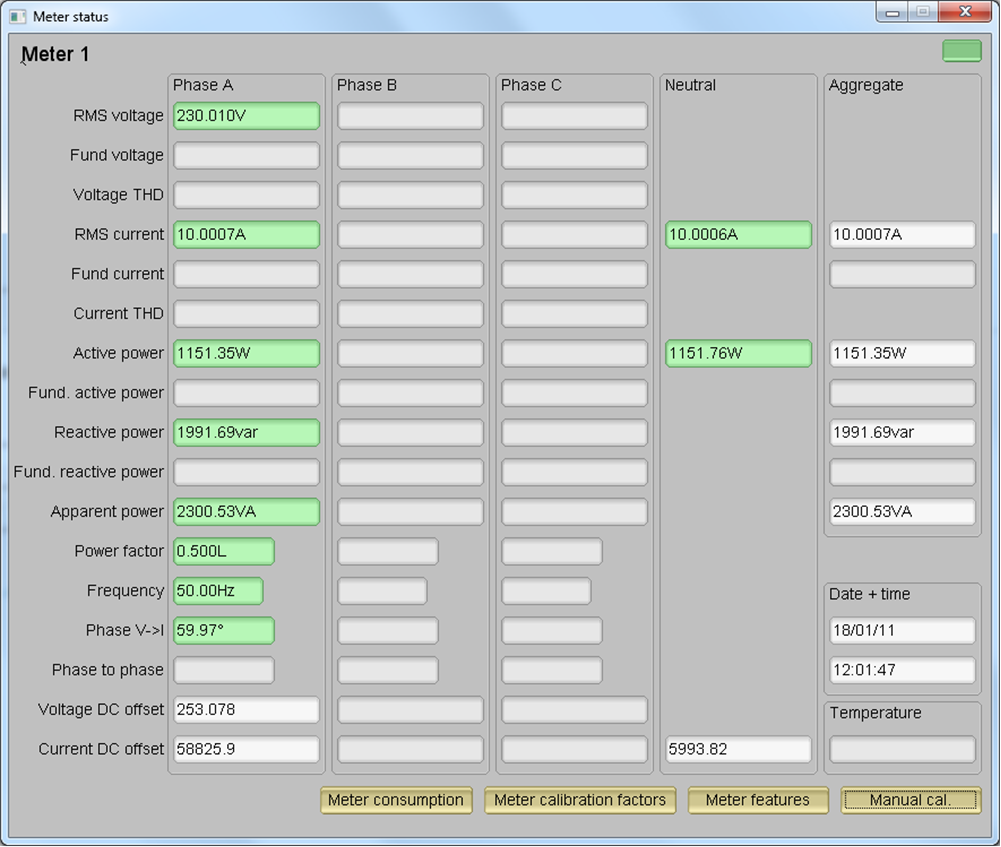
Upon clicking on the green button, the results window opens (see Figure 2-32). In the figure, there is a trailing "L" or "C" on the Power factor values to indicate an inductive or capacitive load, respectively. Note that by default, the column in the GUI labeled "Phase A" is actually the shunt channel and the column labeled "Neutral" is actually the CT channel. If the system and shunt is referenced with respect to the neutral, the shunt would actually measure the neutral current and the CT would measure the line current, unlike how the GUI is labeled.
 Figure 2-32 GUI Results Window
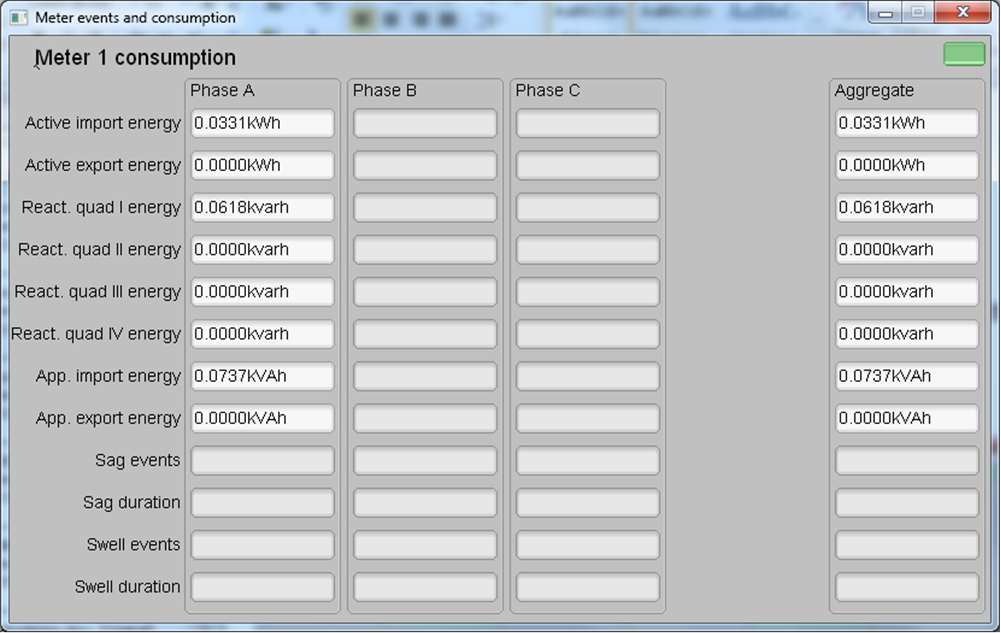
From the results window, the total-energy consumption readings can be viewed by clicking the Meter Consumption button. After the user clicks this button, the Meter events and consumption window pops up, as Figure 2-33 shows.
 Figure 2-33 Meter Events and Consumption Window
From the results window, the meter settings can be viewed by clicking the Meter features button, view the system calibration factors by clicking the Meter calibration factors button, or open the window used for calibrating the system by clicking the Manual cal. button.