TIDUEM7A April 2019 – February 2021
- Description
- Resources
- Features
- Applications
- 5
- 1System Description
-
2System Overview
- 2.1 Block Diagram
- 2.2 Highlighted Products
- 2.3 Design Considerations
- 2.4
Hardware, Software, Testing Requirements, and Test Results
- 2.4.1 Required Hardware and Software
- 2.4.2
Testing and Results
- 2.4.2.1 Test Setup
- 2.4.2.2 Test Results
- 3Design Files
- 4Related Documentation
- 5About the Author
- 6Revision History
2.4.2.2.2 Electricity Meter Metrology Accuracy Results
For the following test results, gain, phase, and offset calibration are applied to the meter. At higher currents, the % error shown is dominated by shunt resistance drift caused by the increased heat generated at high currents.
Table 2-8 Active Energy % Error Versus Current,
200-µΩ Shunts
200-µΩ Shunts
| CURRENT (A) | 0° | 60° | –60° |
|---|---|---|---|
| 0.05 | 0.0625 | 0.137 | 0.034 |
| 0.10 | 0.036 | 0.048 | 0.072 |
| 0.25 | –0.0027 | 0.041 | 0.058 |
| 0.50 | –0.022 | 0.004 | 0.022 |
| 1.00 | –0.0123 | 0.004 | –0.014 |
| 2.00 | –0.0293 | –0.024 | –0.019 |
| 5.00 | –0.0123 | –0.024 | 0.001 |
| 10.00 | –0.0127 | –0.023 | 0.0003 |
| 20.00 | –0.0233 | –0.032 | –0.032 |
| 30.00 | –0.019 | –0.019 | –0.028 |
| 40.00 | –0.025 | –0.026 | –0.032 |
| 50.00 | –0.03 | –0.05 | –0.03 |
| 60.00 | –0.058 | –0.075 | –0.062 |
| 70.00 | –0.088 | –0.117 | –0.092 |
| 80.00 | –0.1243 | –0.164 | –0.151 |
| 90.00 | –0.181 | –0.224 | –0.219 |
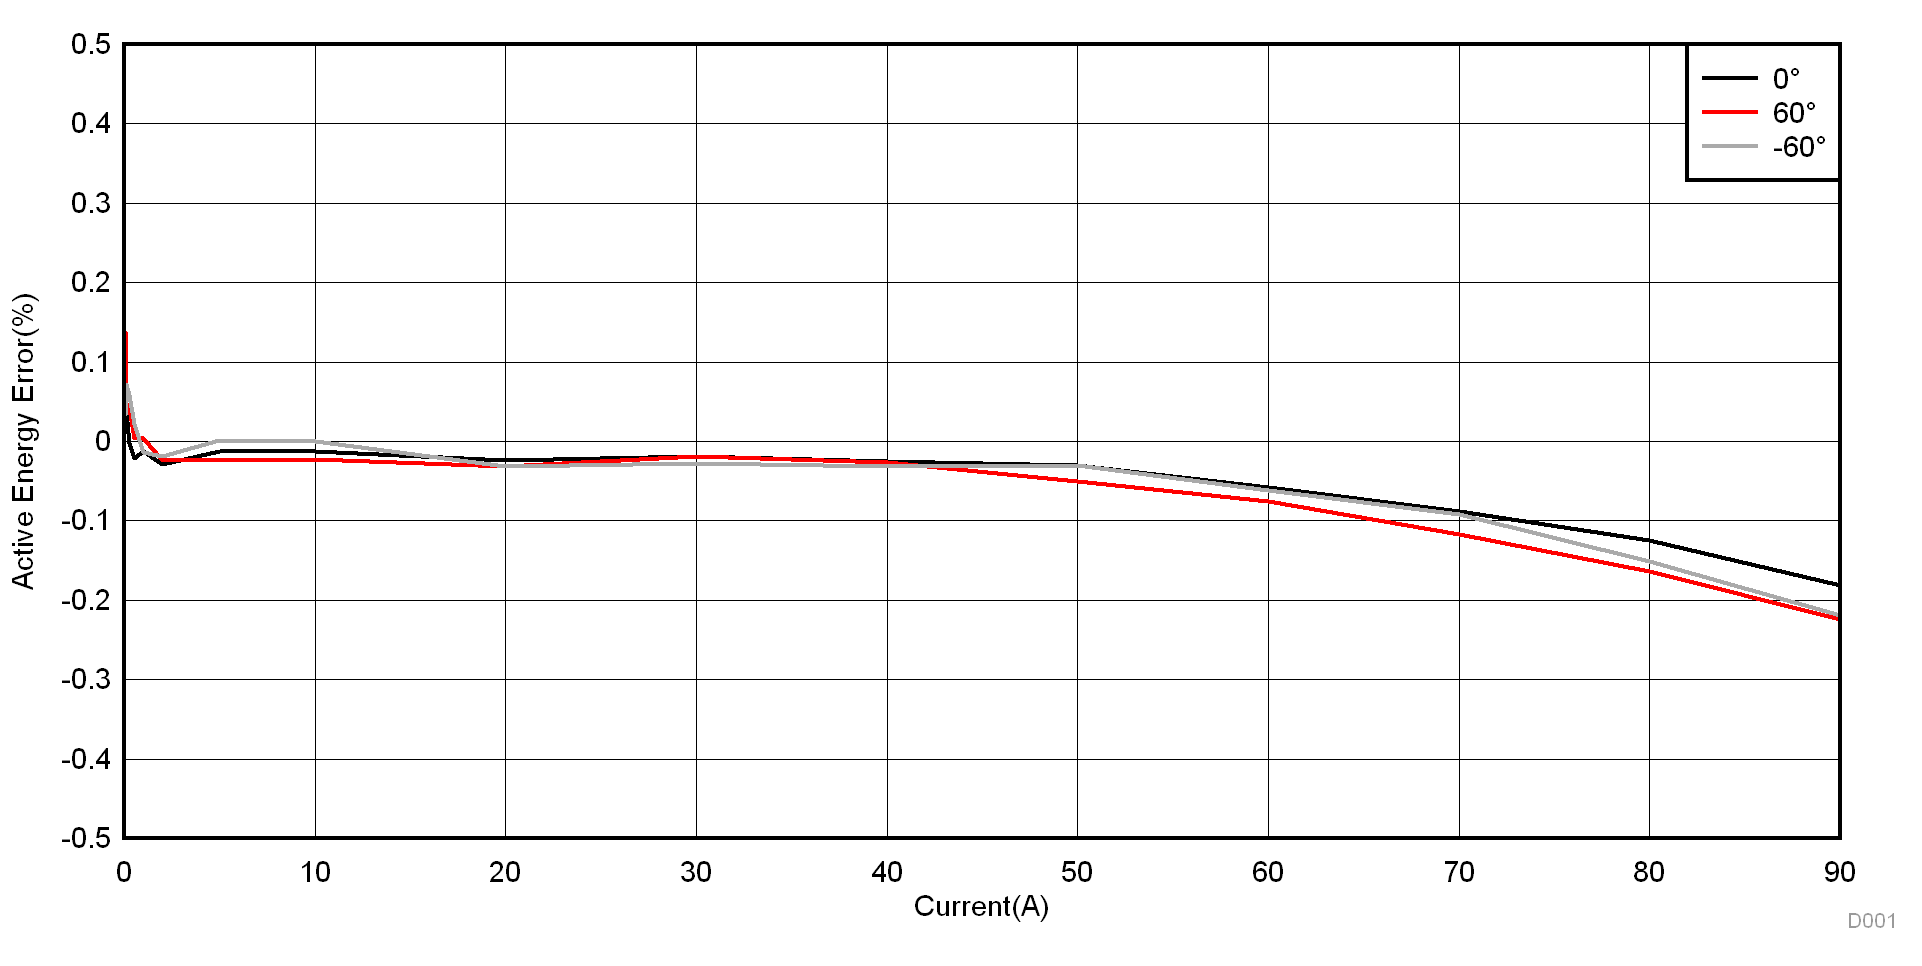 Figure 2-37 Active Energy % Error Versus Current, 200-µΩ Shunts
Table 2-9 Active Energy % Error Versus Current,
100-µΩ Shunts
100-µΩ Shunts
| CURRENT (A) | 0° | 60° | –60° |
|---|---|---|---|
| 0.05 | 0.147 | 0.216 | 0.209 |
| 0.10 | –0.042 | –0.052 | –0.058 |
| 0.25 | 0.035 | 0.093 | 0.0175 |
| 0.50 | 0.0453 | 0.037 | –0.009 |
| 1.00 | 0.013 | 0.0377 | –0.017 |
| 2.00 | –0.0167 | 0.0303 | –0.011 |
| 5.00 | 0.006 | 0.032 | –0.014 |
| 10.00 | 0.009 | 0.034 | –0.014 |
| 20.00 | –0.007 | 0.032 | –0.045 |
| 30.00 | –0.002 | 0.04 | –0.036 |
| 40.00 | –0.007 | 0.032 | –0.007 |
| 50.00 | –0.004 | 0.017 | –0.035 |
| 60.00 | –0.019 | –0.002 | –0.058 |
| 70.00 | –0.053 | –0.032 | –0.092 |
| 80.00 | ––0.083 | –0.07 | –0.143 |
| 90.00 | –0.122 | –0.113 | –0.19 |
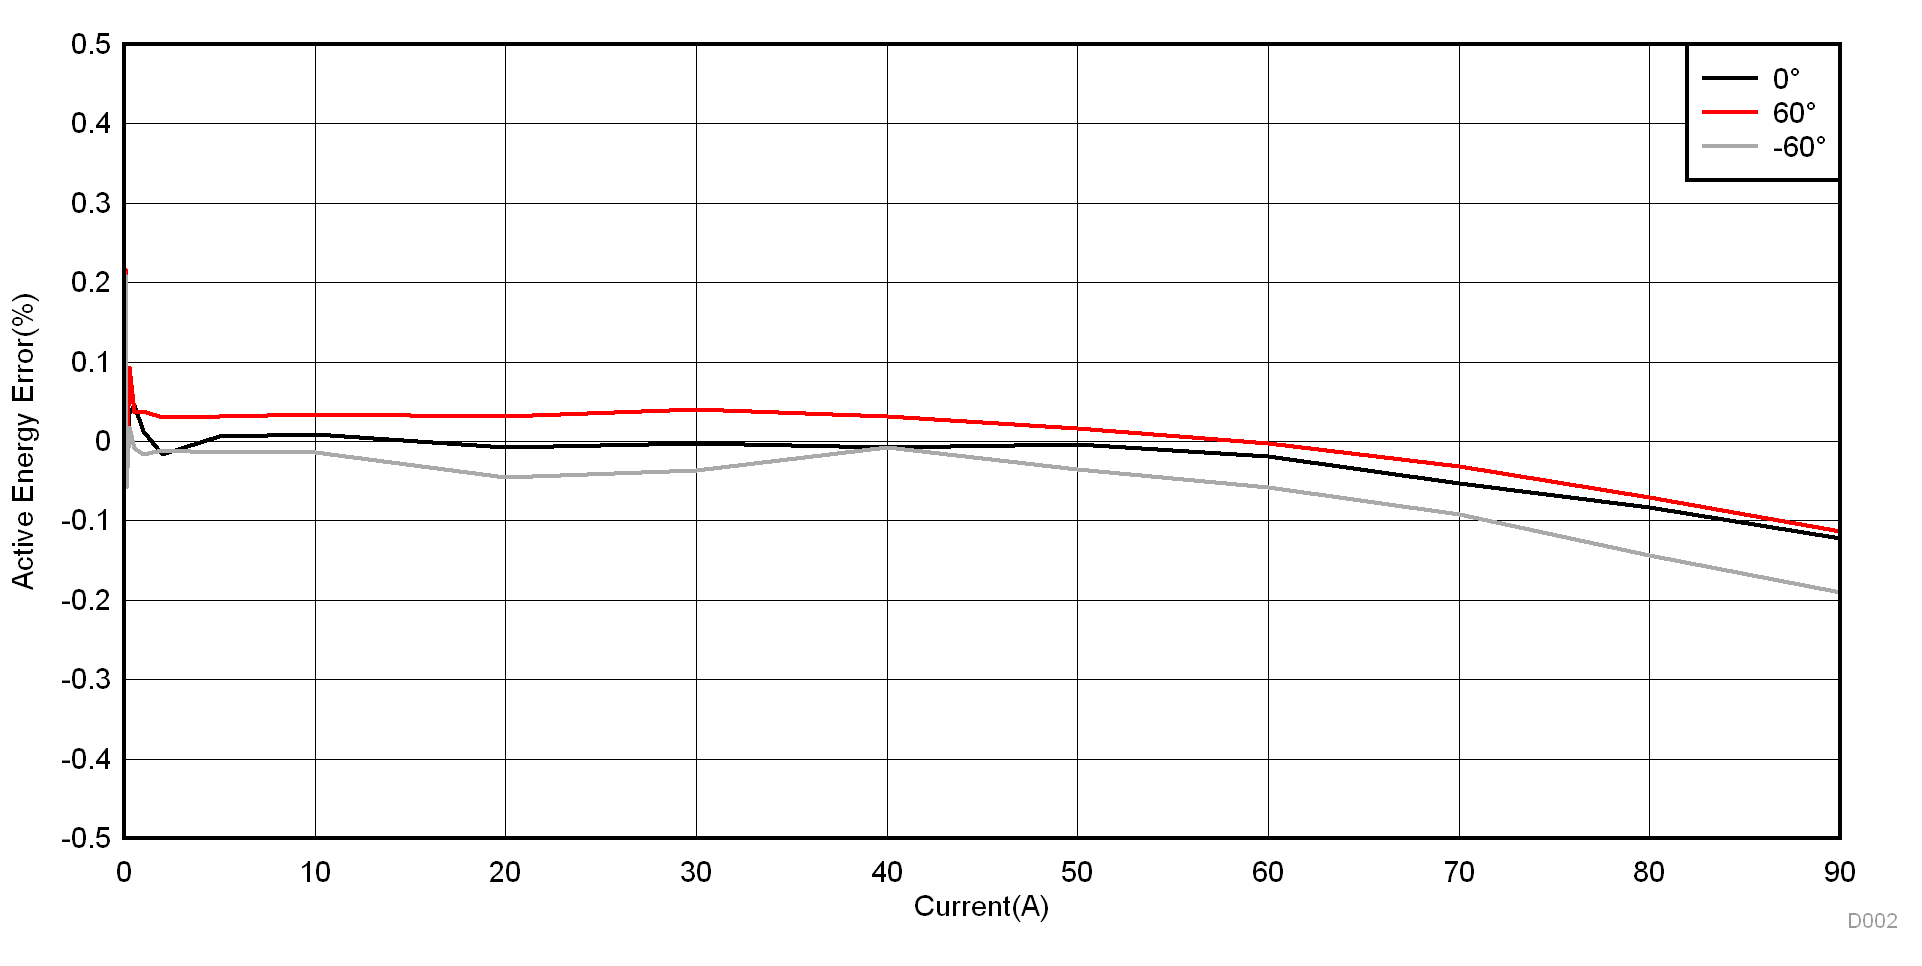 Figure 2-38 Active Energy % Error Versus Current, 100-µΩ Shunts
Table 2-10 CT Channel Active Energy % Error Versus Current
| CURRENT (A) | 0° | 60° | –60° |
|---|---|---|---|
| 0.05 | 0.01 | –0.004 | –0.011 |
| 0.10 | 0.007 | 0.019 | 0.005 |
| 0.25 | –0.004 | 0.017 | –0.021 |
| 0.50 | 0.006 | 0.024 | –0.017 |
| 1.00 | 0.009 | 0.027 | –0.009 |
| 2.00 | –0.011 | 0.019 | –0.041 |
| 5.00 | 0.006 | 0.006 | 0.001 |
| 10.00 | 0.0015 | –0.004 | 0.004 |
| 20.00 | –0.015 | –0.019 | 0.006 |
| 30.00 | –0.011 | –0.045 | 0.023 |
| 40.00 | –0.013 | –0.07 | 0.038 |
| 50.00 | –0.004 | –0.081 | 0.083 |
| 60.00 | –0.005 | –0.092 | 0.087 |
| 70.00 | –0.001 | –0.0997 | 0.109 |
| 80.00 | 0.013 | –0.106 | 0.115 |
| 90.00 | 0 | –0.102 | 0.134 |
| 100.00 | 0.018 | –0.111 | 0.147 |
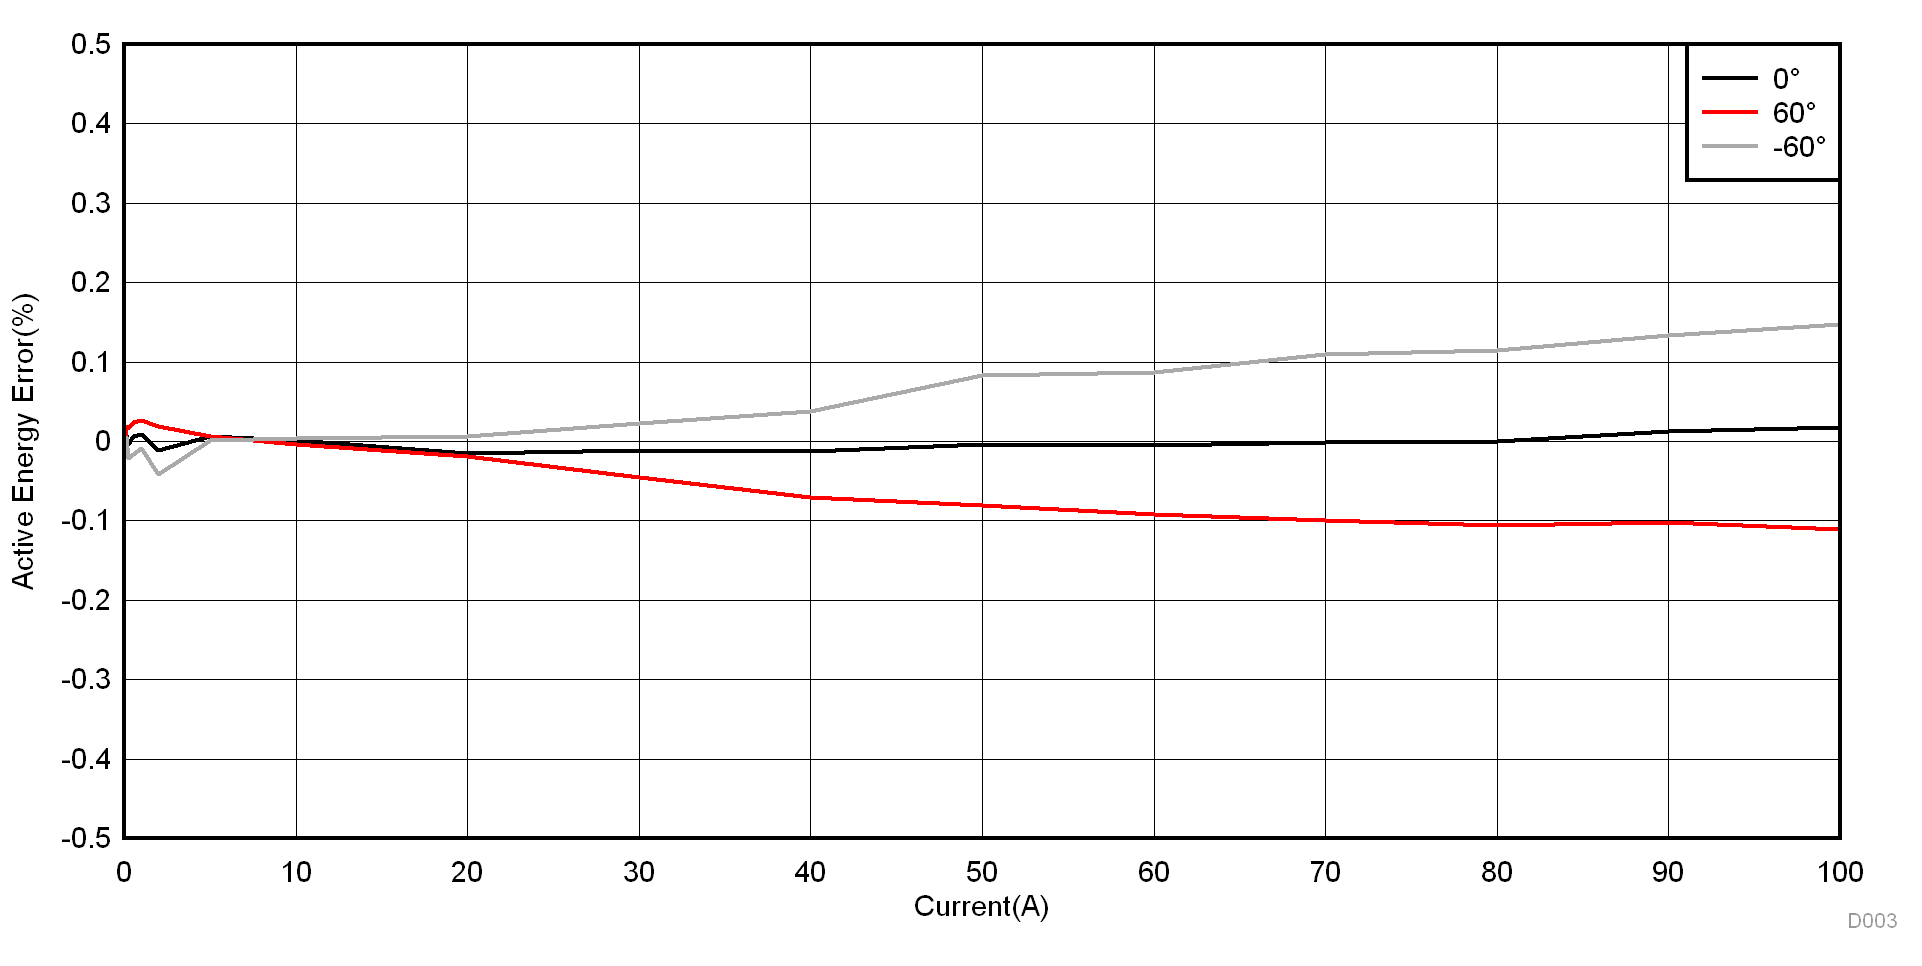 Figure 2-39 CT Channel Active Energy % Error Versus Current
Table 2-11 Reactive Energy % Error Versus Current,
200-µΩ Shunts
200-µΩ Shunts
| CURRENT (A) | 30° | 60° | –30° | –60° |
|---|---|---|---|---|
| 0.10 | –0.035 | 0.001 | 0.118 | 0.056 |
| 0.25 | 0.032 | 0.008 | –0.022 | 0.008 |
| 1.00 | 0.009 | 0.014 | 0.006 | –0.0013 |
| 5.00 | 0.017 | 0.006 | 0.011 | 0.006 |
| 10.00 | 0.0195 | 0.014 | 0.006 | 0.006 |
| 30.00 | 0.006 | 0.0017 | 0.006 | 0.006 |
| 50.00 | 0.017 | –0.004 | –0.009 | –0.0115 |
| 70.00 | –0.019 | –0.0415 | –0.063 | –0.085 |
| 90.00 | –0.1 | –0.133 | –0.151 | –0.194 |
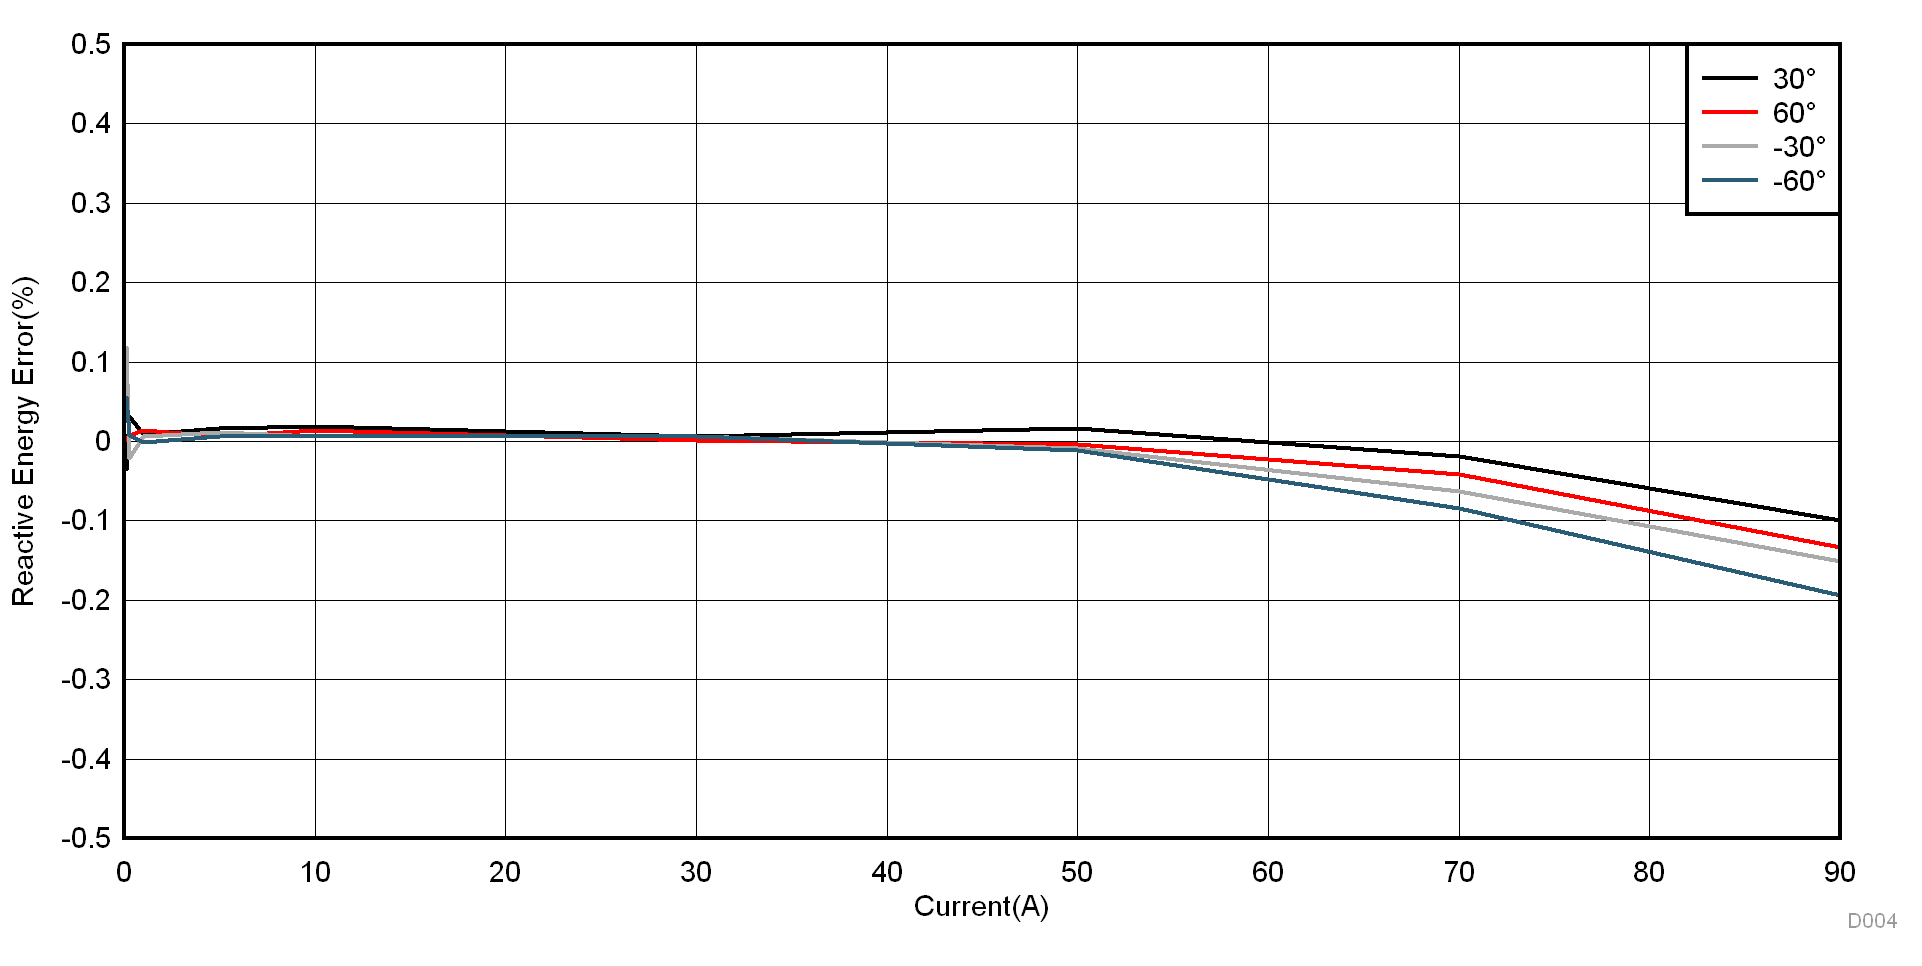 Figure 2-40 Reactive Energy % Error Versus Current, 200-µΩ Shunts
Table 2-12 Active Energy Measurement Error Versus Voltage, 75 to 270 V, 200-µΩ Shunts
| VOLTAGE (V) | %ERROR |
|---|---|
| 75 | –0.119 |
| 100 | –0.101 |
| 110 | –0.093 |
| 120 | –0.091 |
| 150 | –0.068 |
| 180 | –0.0435 |
| 210 | –0.0233 |
| 220 | –0.014 |
| 230 | 0.003 |
| 240 | 0.0053 |
| 250 | 0.006 |
| 260 | 0.017 |
| 270 | 0.02 |
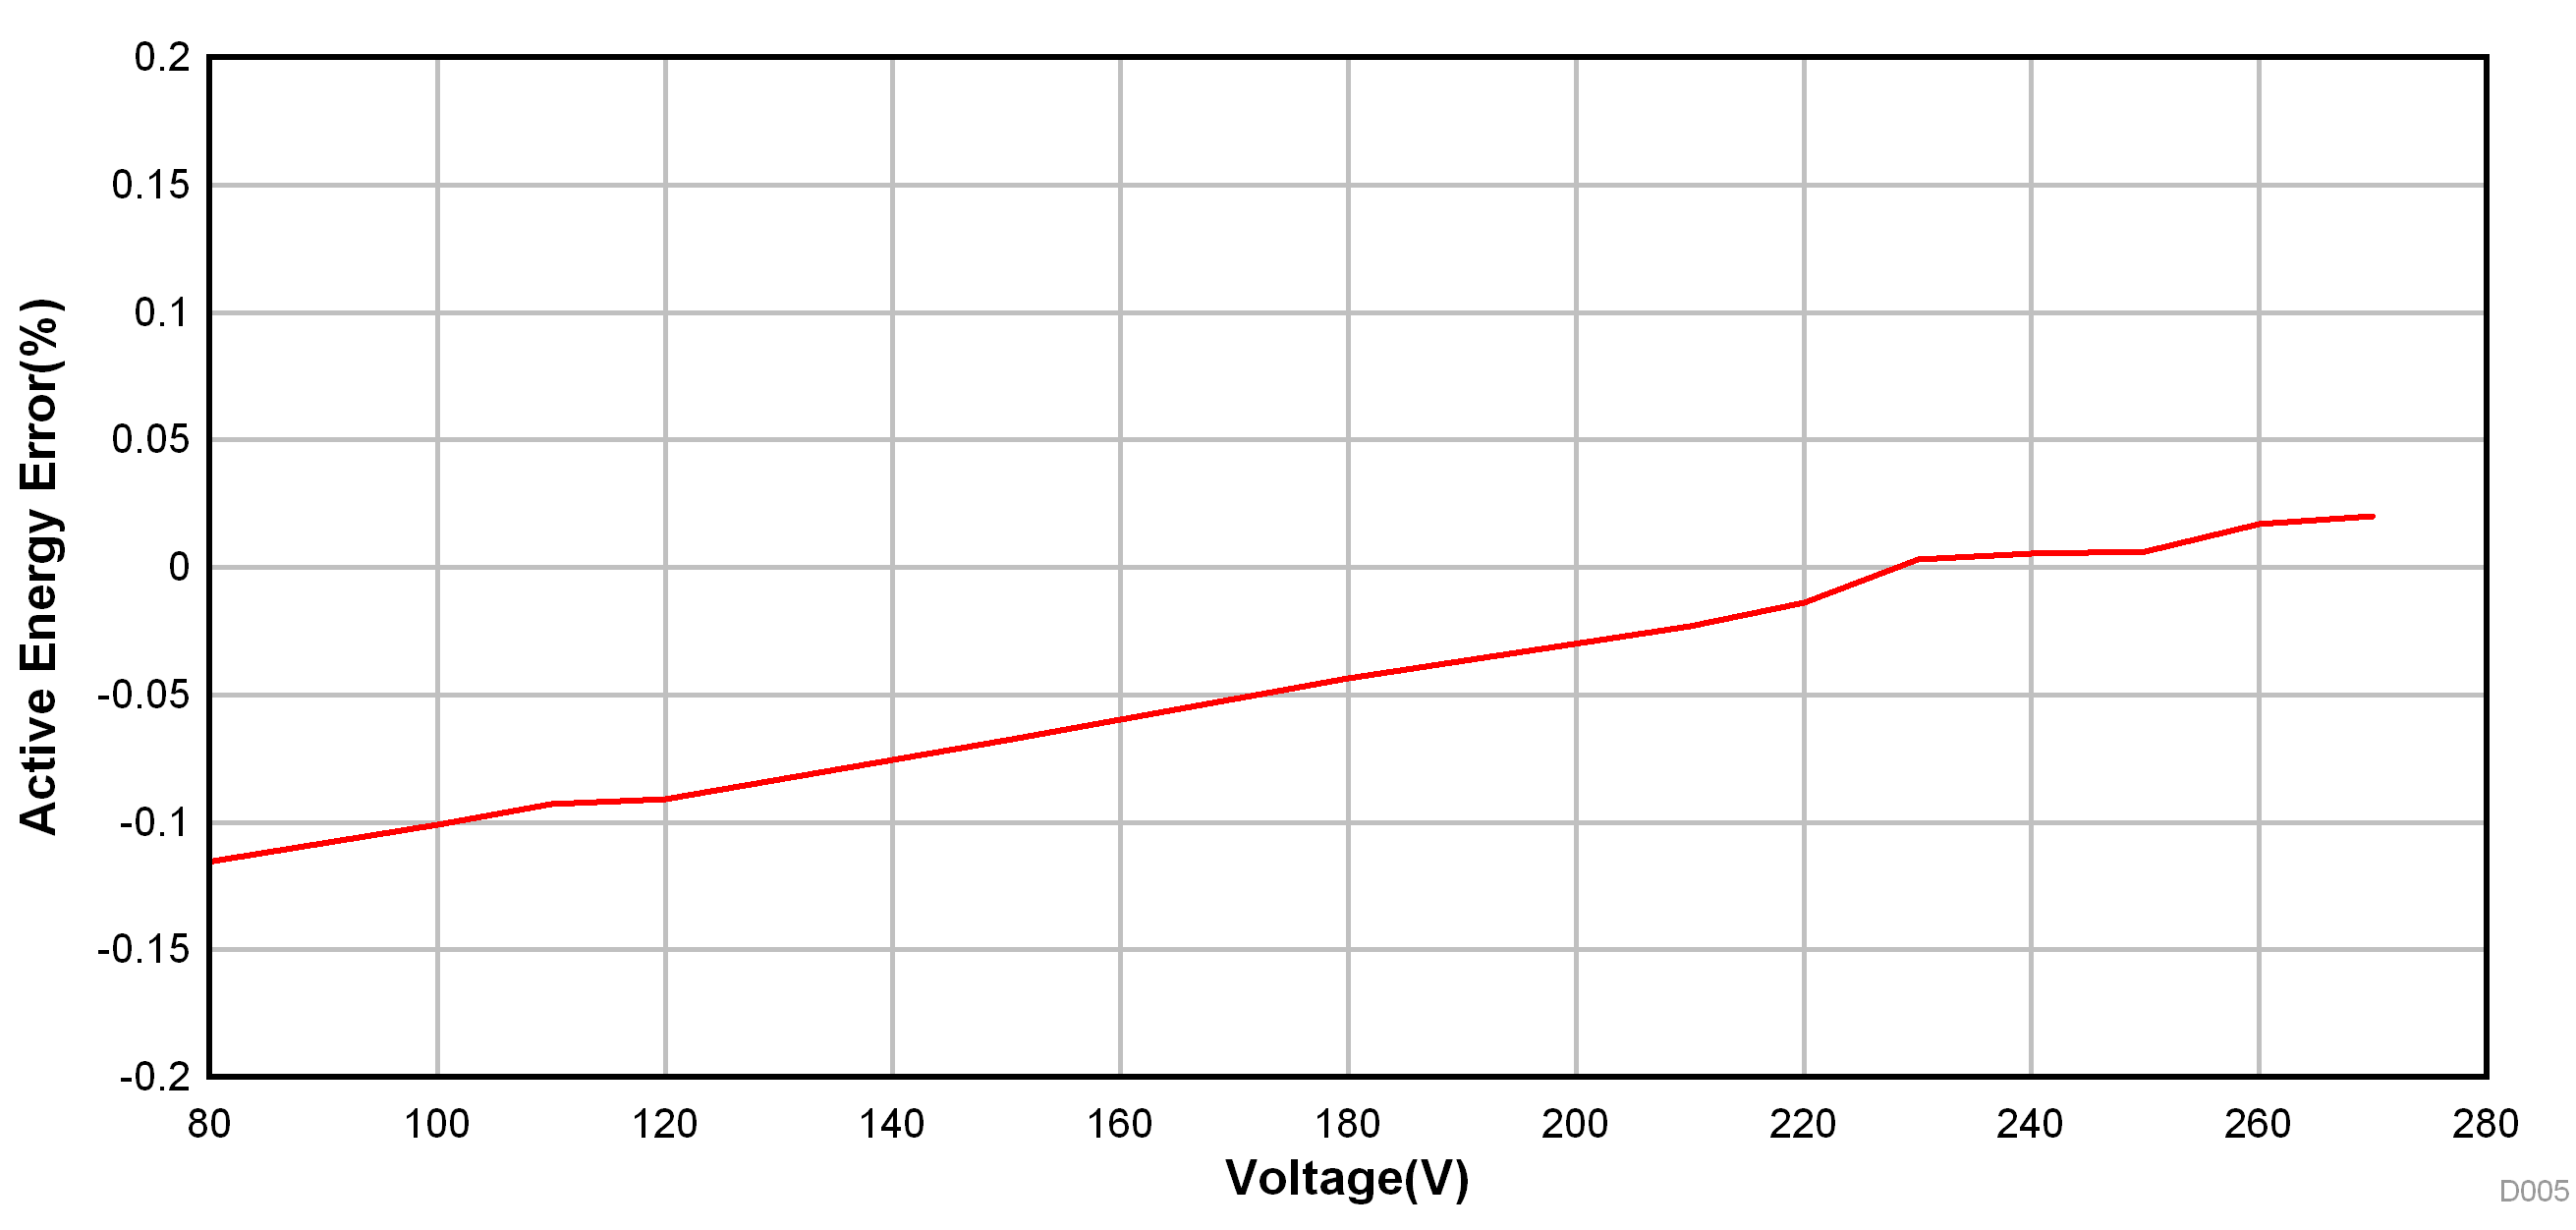 Figure 2-41 Active Energy Measurement Error Versus Voltage, 75 to 270 V, 200-µΩ Shunts
Table 2-13 Cumulative Active Energy Measurement Error Versus Voltage, ±10% Nominal Voltage
| VOLTAGE (V) | 0°, 10 A | 60°, 10 A | 300°, 10 A | 0°, 0.5 A | 60°, 0.5 A | 300°, 0.5 A |
|---|---|---|---|---|---|---|
| 207 | –0.028 | –0.045 | –0.012 | –0.0073 | 0.017 | 0.027 |
| 230 | –0.01 | –0.022 | 0.004 | –0.004 | –0.007 | –0.012 |
| 253 | 0.006 | –0.004 | 0.011 | 0.011 | –0.009 | 0.011 |
Table 2-14 Cumulative Active Energy Measurement Error Versus Frequency,
±2 Hz From Nominal Frequency, 200-µΩ Shunts
±2 Hz From Nominal Frequency, 200-µΩ Shunts
| CONDITIONS | 48 Hz | 50 Hz | 52 Hz |
|---|---|---|---|
| 0.5 A, 0 | 0.009 | 0.001 | 0.006 |
| 0.5 A, 60 | 0.001 | –0.012 | –0.017 |
| 0.5 A, 300 | 0.034 | 0.045 | 0.014 |
| 10 A, 0 | –0.007 | –0.011 | –0.009 |
| 10 A, 60 | –0.022 | –0.0245 | –0.027 |
| 10 A, 300 | 0.006 | 0.004 | –0.001 |