TIDUEM7A April 2019 – February 2021
- Description
- Resources
- Features
- Applications
- 5
- 1System Description
-
2System Overview
- 2.1 Block Diagram
- 2.2 Highlighted Products
- 2.3 Design Considerations
- 2.4
Hardware, Software, Testing Requirements, and Test Results
- 2.4.1 Required Hardware and Software
- 2.4.2
Testing and Results
- 2.4.2.1 Test Setup
- 2.4.2.2 Test Results
- 3Design Files
- 4Related Documentation
- 5About the Author
- 6Revision History
2.3.2.3.2.1 Formulas
This section briefly describes the formulas used for the voltage, current, power, and energy calculations. As previously described, voltage and current samples are obtained at a sampling rate of 8000 Hz. All of the samples that are taken in approximately one second frames are kept and used to obtain the RMS values for voltage and current. The RMS values are obtained with the following formulas:
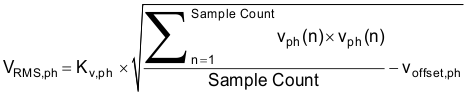
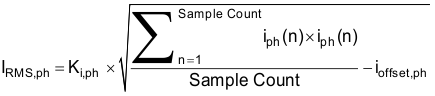
where
- Vph(n) = Voltage sample at a sample instant n
- Voffset,ph = Offset used to subtract effects of the additive white Gaussian noise from the voltage converter
- Iph(n) = Each current sample at a sample instant n
- Ioffset,ph = Offset used to subtract effects of the additive white Gaussian noise from the current converter
- Sample count = Number of samples within the present frame
- Kv,ph = Scaling factor for voltage
- Ki,ph = Scaling factor for current
Power and energy are calculated for active and reactive energy samples of one frame. These samples are phase-corrected and passed on to the foreground process, which uses the number of samples (sample count) to calculate phase active and reactive powers through the following formulas:
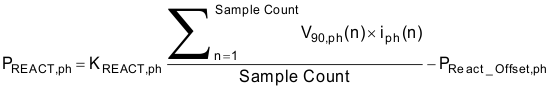
where
- V90(n) = Voltage sample at a sample instant ‘n’ shifted by 90°
- KACT,ph = Scaling factor for active power
- KREACT,ph = Scaling factor for reactive power
- PACT_offset,ph = Offset used to subtract effects of crosstalk on the active power measurements
- PREACT_offset,ph = Offset used to subtract effects of crosstalk on the reactive power measurements
Note that for reactive energy, the 90° phase shift approach is used for two reasons:
- This approach allows accurate measurement of the reactive power for very small currents
- This approach conforms to the measurement method specified by IEC and ANSI standards
The calculated mains frequency is used to calculate the 90 degrees-shifted voltage sample. Because the frequency of the mains varies, the mains frequency is first measured accurately to phase-shift the voltage samples accordingly.
To get an exact 90° phase shift, interpolation is used between two samples. For these two samples, a voltage sample slightly more than 90 degrees before the current sample and a voltage sample slightly less than 90 degrees before the current sample are used. The phase shift implementation of the application consists of an integer part and a fractional part. The integer part is realized by providing an N samples delay. The fractional part is realized by a one-tap FIR filter. In the test software, a lookup table provides the filter coefficients that are used to create the fractional delays.
Using the calculated powers, energies are calculated with the following formulas in Equation 12:
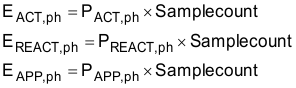
The calculated energies are then accumulated into buffers that store the total amount of energy consumed since system reset. Note that these energies are different from the working variables used to accumulate energy for outputting energy pulses. There are four sets of buffers that are available: one for each phase and one for the cumulative of the phases. Within each set of buffers, the following energies are accumulated:
- Active import energy (active energy when active energy ≥ 0)
- Active export energy (active energy when active energy < 0)
- React. Quad I energy (reactive energy when reactive energy ≥ 0 and active power ≥ 0; inductive load)
- React. Quad II energy (reactive energy when reactive energy ≥ 0 and active power < 0; capacitive generator)
- React. Quad III energy (reactive energy when reactive energy < 0 and active power < 0; inductive generator)
- React. Quad IV energy (reactive energy when reactive energy < 0 and active power ≥ 0; capacitive load)
- App. import energy (apparent energy when active energy ≥ 0)
- App. export energy (apparent energy when active energy < 0)
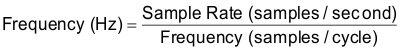
The background process also calculates the frequency in terms of samples-per-mains cycle. The foreground process then converts this samples-per-mains cycle to Hertz with Equation 13:
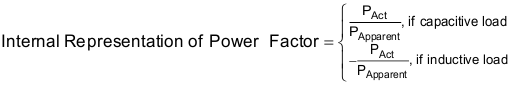
After the active power and apparent power are calculated, the absolute value of the power factor is calculated. In the internal representation of power factor of the system, a positive power factor corresponds to a capacitive load; a negative power factor corresponds to an inductive load. The sign of the internal representation of power factor is determined by whether the current leads or lags voltage, which is determined in the background process. Therefore, the internal representation of power factor is calculated with Equation 14: