TIDT228 October   2022


  1.   Description
  2.   Features
  3.   Applications
  4. 1Specifications
    1. 1.1 Voltage and Current Requirements
    2. 1.2 Dimensions
  5. 2Testing and Results
    1. 2.1 Standby Power Consumption
    2. 2.2 Efficiency Graphs
    3. 2.3 Thermal Images
    4. 2.4 Bode Plots
    5. 2.5 Conducted EMI
  6. 3Waveforms
    1. 3.1 Switching
    2. 3.2 Output Voltage Ripple
    3. 3.3 Load Transients
    4. 3.4 Start-Up

Bode Plots

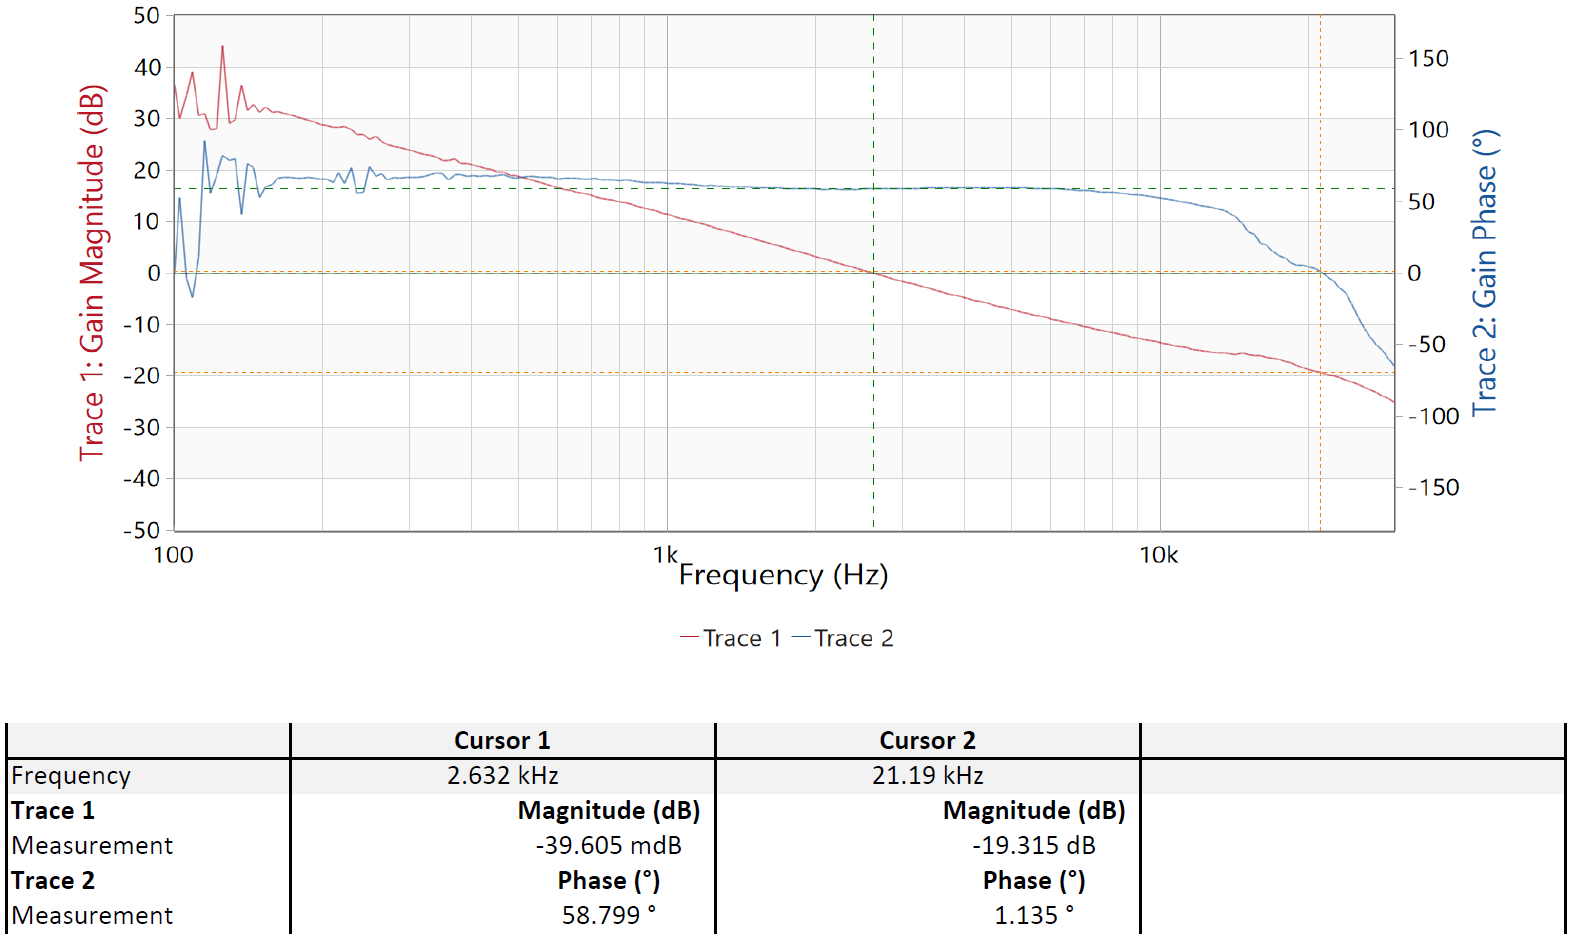
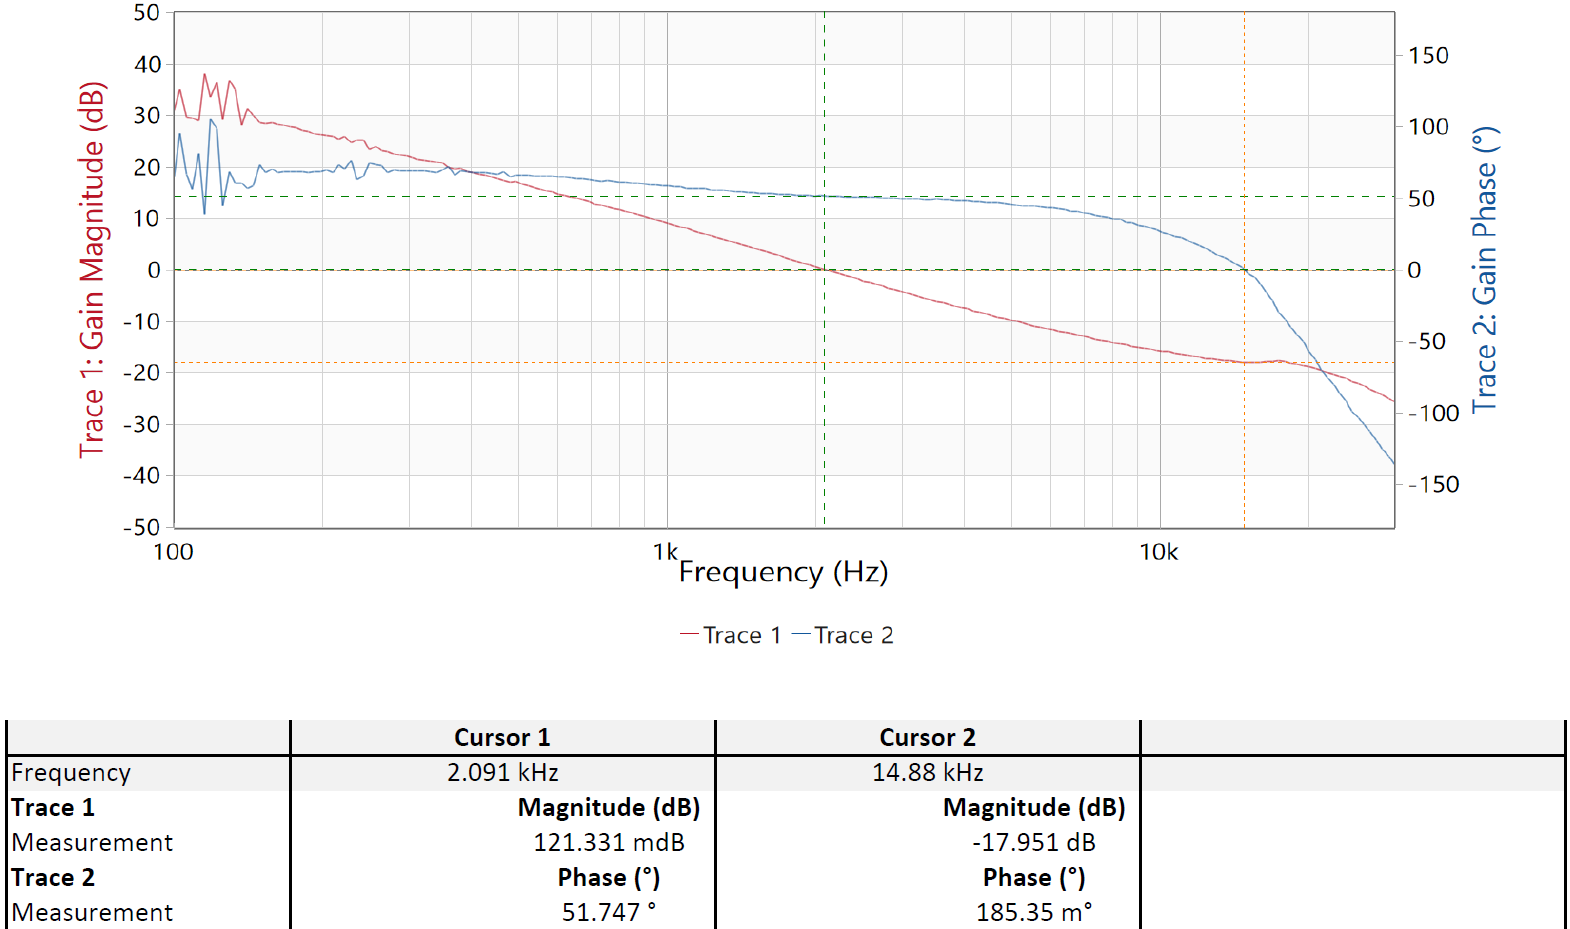
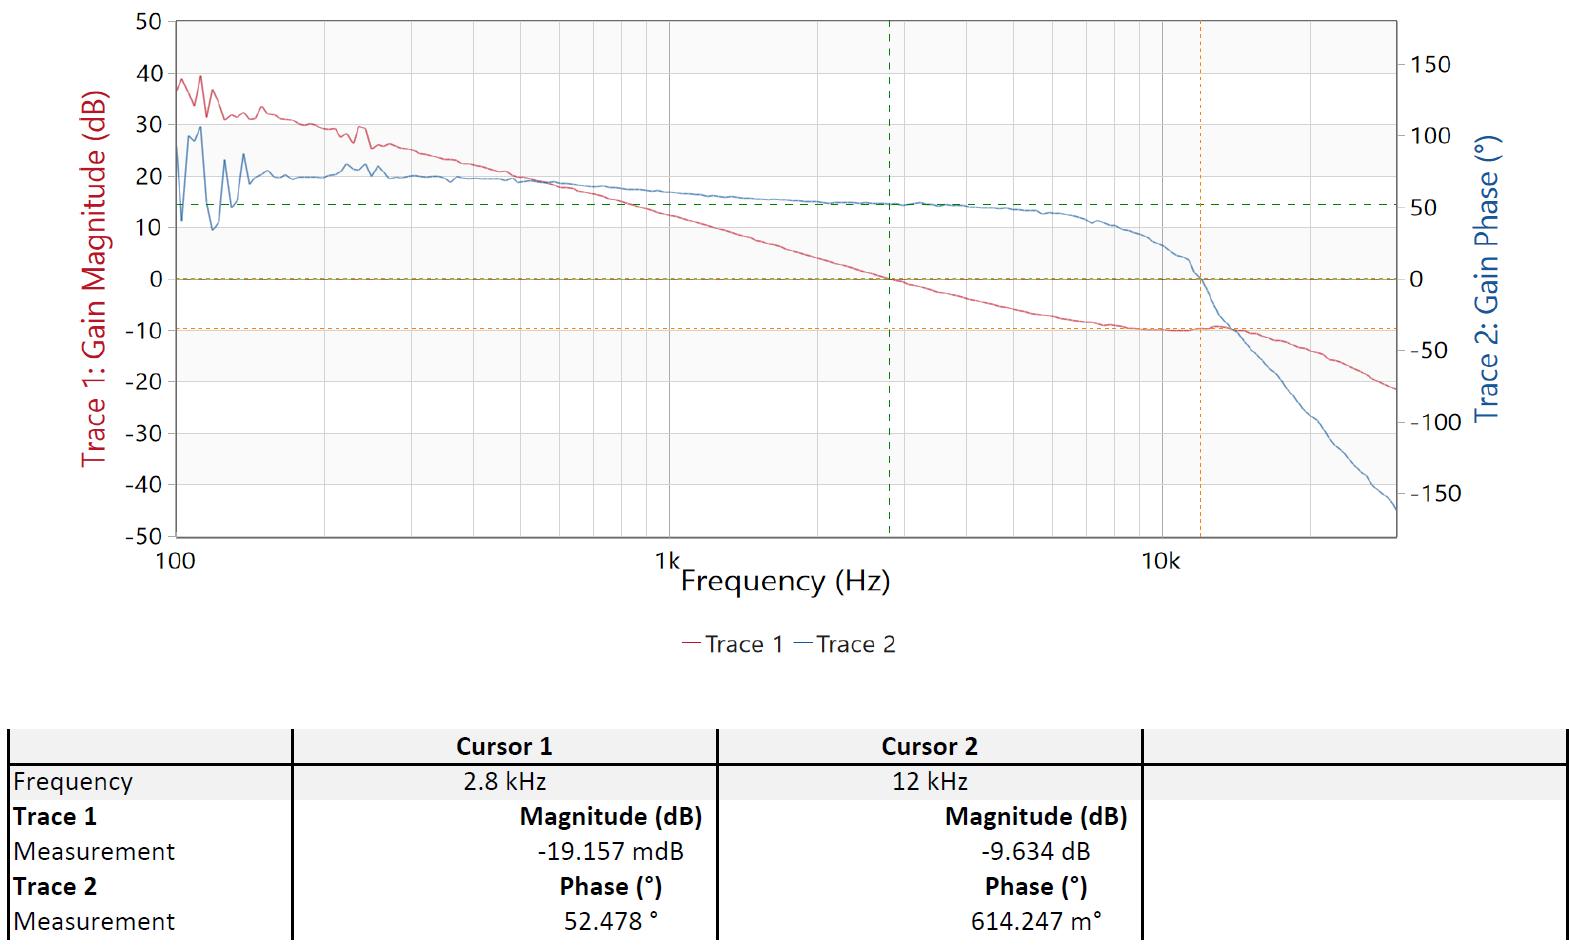
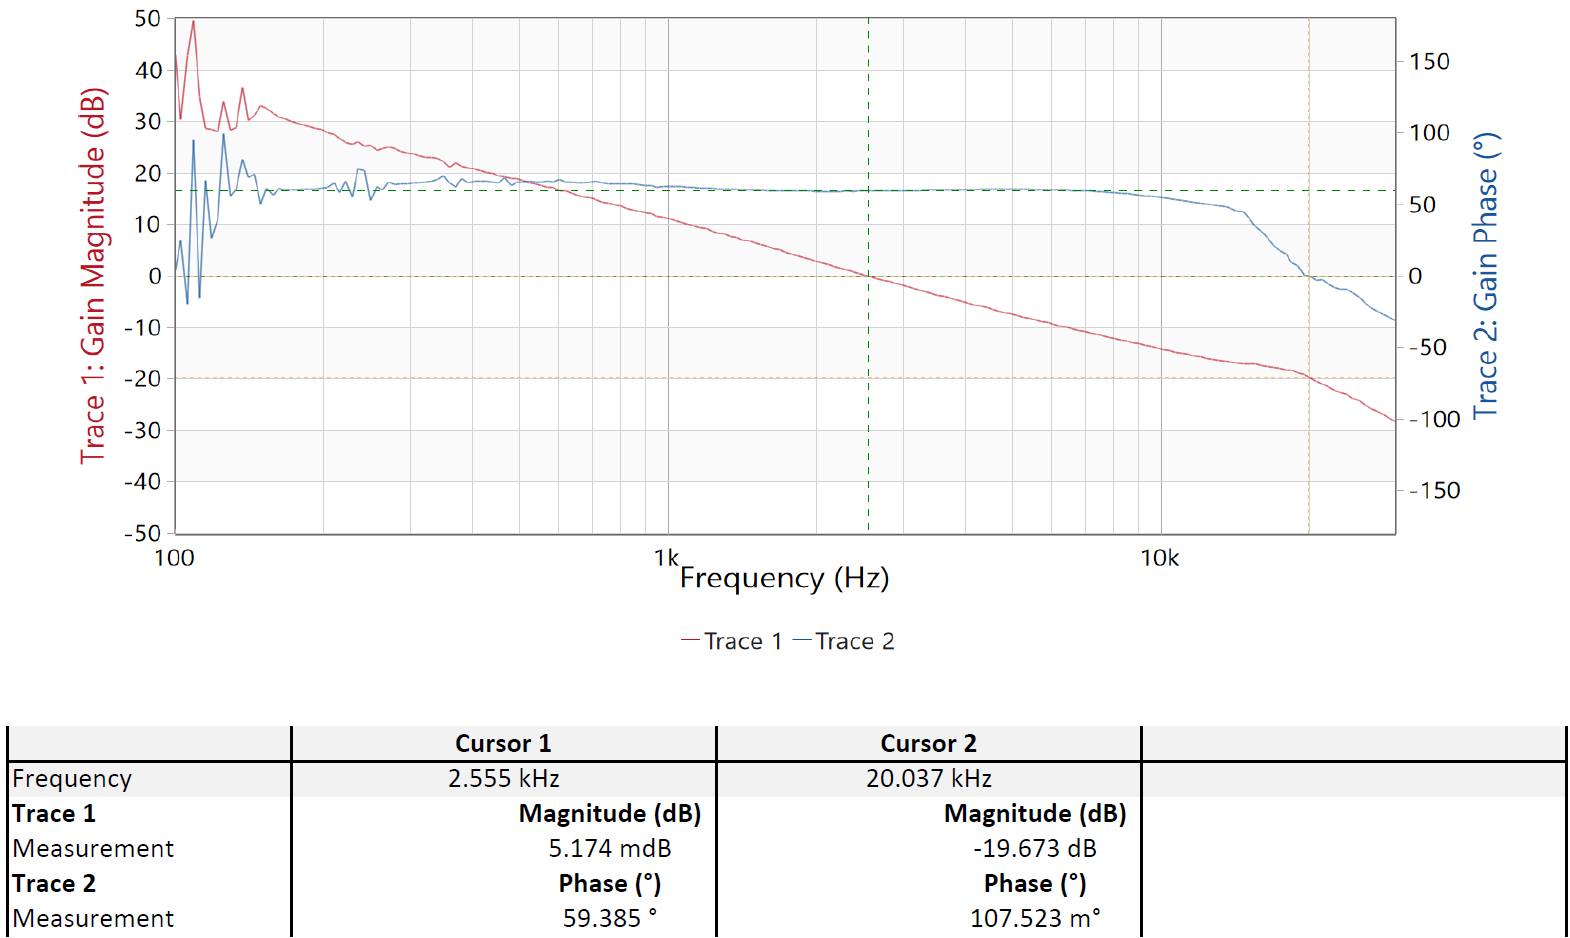
The following frequency responses were measured with a 115 VAC, 60-Hz input voltage. Data was taken on the revision D2 board.
GUID-20210213-CA0I-15LB-DXRP-JLCFF2RV25QH-low.pngFigure 2-17 20-V Output With 3-A Load
GUID-20210213-CA0I-NHRL-LVQZ-SCCCQP6ZWTMZ-low.pngFigure 2-18 15-V Output With 4-A Load
GUID-20210213-CA0I-K1Q1-RC3V-KQMJPBVBK0FK-low.pngFigure 2-19 9-V Output With 6-A Load
GUID-20210213-CA0I-NRJW-TS21-PNRC5HZN8NH3-low.pngFigure 2-20 5-V Output With 6-A Load