SBVA100 December 2022 LP2992 , TPS786 , TPS7A30 , TPS7A3001-EP , TPS7A33 , TPS7A39 , TPS7A4501-SP , TPS7A47 , TPS7A47-Q1 , TPS7A4701-EP , TPS7A49 , TPS7A52 , TPS7A52-Q1 , TPS7A53 , TPS7A53-Q1 , TPS7A53A-Q1 , TPS7A53B , TPS7A54 , TPS7A54-Q1 , TPS7A57 , TPS7A7100 , TPS7A7200 , TPS7A7300 , TPS7A80 , TPS7A8300 , TPS7A83A , TPS7A84 , TPS7A84A , TPS7A85 , TPS7A85A , TPS7A87 , TPS7A89 , TPS7A90 , TPS7A91 , TPS7A92 , TPS7A94 , TPS7A96 , TPS7B7702-Q1 , TPS7H1111-SEP , TPS7H1111-SP , TPS7H1210-SEP
3 System VLOAD and Current Sharing Simulation of Parallel LDOs using Ballast Resistors
After the designer has selected RB and the number of parallel LDOs required using the down-loadable software tool [see reference 5], a system simulation can be performed to assess a statistical analysis of the current sharing and VLOAD. The simulation can also provide a statistical assessment of the total DC accuracy of the system. Cadence for TI is an excellent resource for these simulations which we will use for these examples. A complete review and tutorial of Cadence for TI is beyond the scope of this white paper, if desired please see references 6 and 7 for additional guidance on this software simulator.
Consider the example parallel LDO system shown below in Figure 3-1 which is a screen image of the software tool. The load current is 8 A with 20 mV of allocated load regulation due to the additional ballast resistor. 4 m-ohms is the optimum ballast resistance and two parallel TPS7A57 LDOs are used to supply the total load current. The TPS7A57 reference voltage tolerance is ± 1% and the error voltage is ± 2 mV. Thus we expect an upper limit to be 759.5 mV. Including tolerance on VREF and the 20 mV of additional load regulation, we expect a minimum voltage of 722.5 mV. In all cases the output current of each LDO should remain below 5 A.
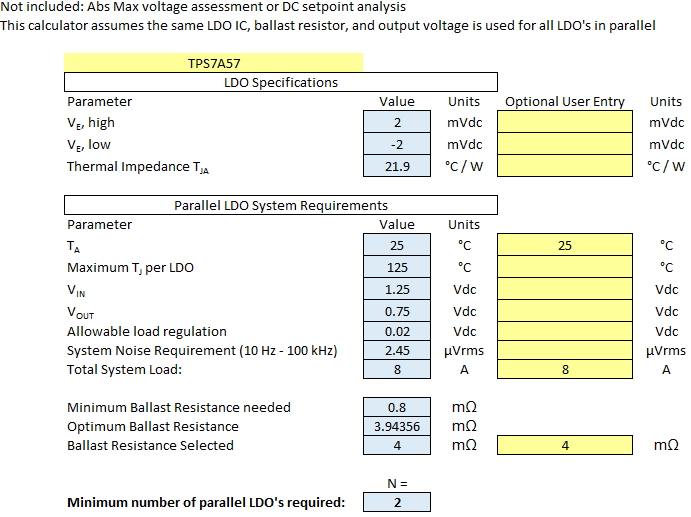 Figure 3-1 Parallel LDO Worst
Case Analysis using 2x TPS7A57
Figure 3-1 Parallel LDO Worst
Case Analysis using 2x TPS7A57Figure 3-2 shows how to model this system in PSpice. We apply voltage sources to model the output voltage (V15) and the error voltages of each LDO (V13 and V14). We use standard resistors for the ballast resistor (Rb1 and Rb2) and a constant current source for the load current (I27).
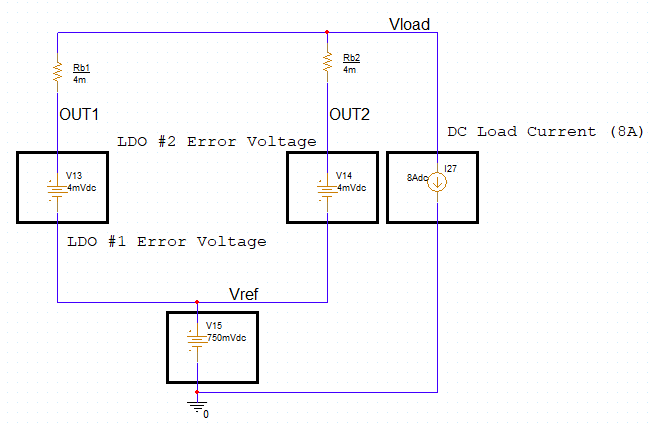 Figure 3-2 Spice Simulation
Schematic of Two Parallel LDOs
Figure 3-2 Spice Simulation
Schematic of Two Parallel LDOsUnfortunately, traditional spice models cannot apply a tolerance to voltage sources or current sources, so we must modify this simulation model. We divide our component tolerances by 6 in the Spice model as typically at least 6 standard deviations will fit in the manufacturer tolerance specification. Limit functions are used to prevent the tails of the Gaussian distribution from exceeding limits which would cause the components to be screened out during manufacturer production. Finally, 1% tolerance resistors are used for the ballast resistance.
A modified model to simulate the maximum IOUTn should keep ILOAD at its maximum value while placing tolerances on all other components in the simulation (Figure 3-3). To be clear, ILOAD = 8 A during the monte carlo simulation. The simulation results for IOUT1 and IOUT2 are provided in Figure 3-2 and Figure 3-2. A summary of these results against the design requirements are provided in Table 3-1.
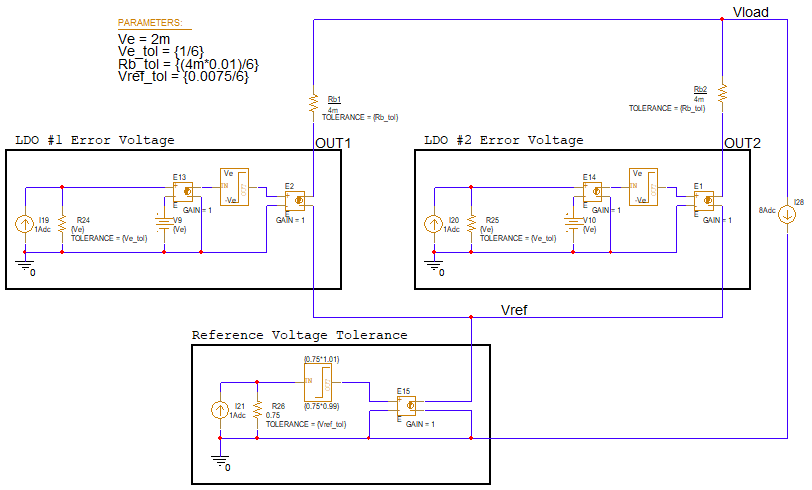 Figure 3-3 Modified PSpice
Schematic to Simulate the IOUTn Distribution of Two
Parallel LDOs
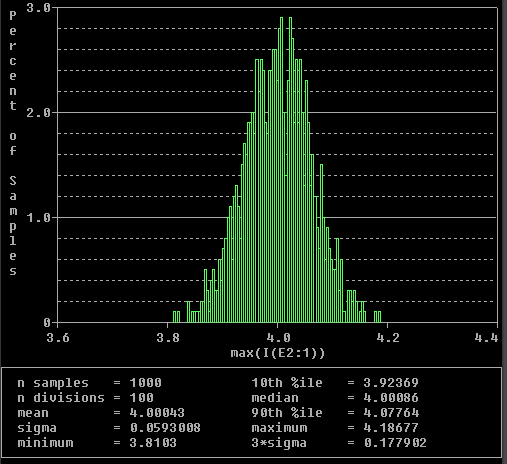 Figure 3-4 IOUT1 Simulation Results
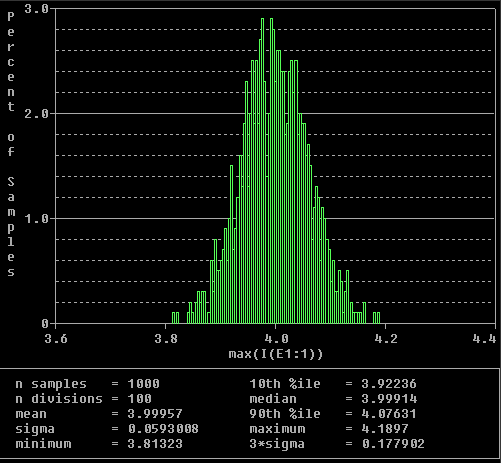 Figure 3-5 IOUT2 Simulation Results
| Parameter | Median Value | Sigma | Statistical Results (+/- 6 sigma) | Requirement(1) |
|---|---|---|---|---|
| IOUT1 | 4.00086 A | 59.3 mA | 4.360 A / 3.645 A | <= 5 A |
| IOUT2 | 3.99914 A | 59.3 mA | 4.355 A / 3.643 A | <= 5 A |
(1) IOUTn must not enter current limit, thus the requirement for the TPS7A57 is 5 A or less.
A modified model to simulate VLOAD will include all tolerances as well as the full range of ILOAD (Figure 3-2). The simulation results for VLOAD is provided in Figure 3-2 and a summary of these results against the design DC accuracy specification is provided in Table 3-2.
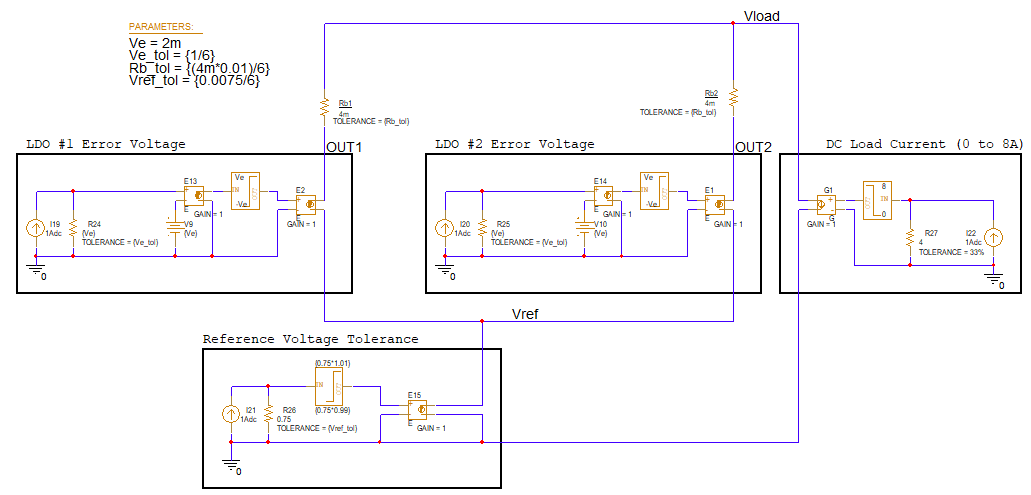 Figure 3-6 Modified
PSpice Schematic to Simulate the VLOAD
Distribution of Two Parallel LDOs
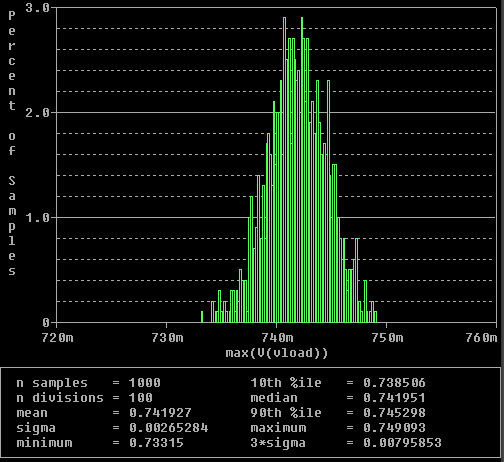 Figure 3-7 VLOAD Simulation Results
The worst case limits are the minimum and maximum VLOAD as calculated from VREF, the error voltage and the increase in load regulation due to the ballast resistors. When ILOAD = 0 A, VLOAD can be as high as 0.75 V × 1.01 + 2 mV = 759.5 mV. When ILOAD = 8 A, VLOAD can be as low as 0.75 V × 0.99 - 20 mV = 722.5 mV. The software tool performs a worst case analysis which includes the 2 mV error voltage on the 20 mV load regulation system specification. Thus, we do not need to subtract another 2 mV from 722.5 mV.
In this example, the worst case limits are outside of the ± 6 sigma statistical results. For designs where VLOAD has a tight tolerance requirement, it is common to set the DC accuracy to be 742.05 mV ± 15.95 mV (which is the same as 742.05 mV ± 2.15%). The extra +1.5 mV / - 3.6 mV can be reallocated to another system specification such as load transient or line transient analysis.
| Parameter | Median Value | Sigma | Statistical Results (± 6 sigma) | Worst Case Limits |
|---|---|---|---|---|
| VLOAD | 742 mV | 2.653 mV | 758 mV / 726.1 mV | < 759.5 mV and > 722.5 mV |