SLVAF10 March 2021 TPS1H000-Q1 , TPS1H100-Q1 , TPS1H200A-Q1 , TPS1HA08-Q1 , TPS1HB08-Q1 , TPS1HB16-Q1 , TPS1HB35-Q1 , TPS1HB50-Q1 , TPS2H000-Q1 , TPS2H160-Q1 , TPS2HB16-Q1 , TPS2HB35-Q1 , TPS2HB50-Q1 , TPS4H000-Q1 , TPS4H160-Q1
3.3.3 Impact of Slew Rate on LED Power
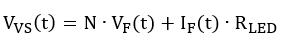
Similarly, we can perform this power analysis for LED applications. For a prototypical LED array, we relate the supply voltage to the forward current at the corresponding voltage as follows, where N is the number of series LEDs per string and M is the parallel strings.
 Figure 3-9 High-Side Switch Driving LED
Load
Figure 3-9 High-Side Switch Driving LED
Load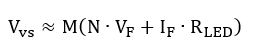
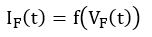
 Figure 3-10 Cree JB82835 0.5-W LED I-V
Characteristic
Figure 3-10 Cree JB82835 0.5-W LED I-V
CharacteristicFor most purposes, assuming the current is already at its peak as soon as the diodes become forward biased is fairly accurate and enables quick estimation.
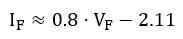
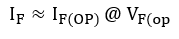
 Figure 3-11 Timing Definitions for LED Power
Analysis
Figure 3-11 Timing Definitions for LED Power
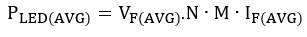
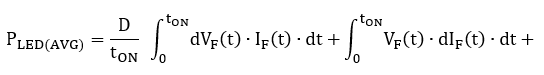
AnalysisAverage power for one cycle is based on the number of parallel LED strings as well, the time-dependent LED forward current, and the HSS output voltage which is distorted by slew rate and PWD, where M is the number of parallel LED strings and N the number of series LEDs.
- Supply voltage: Vvs = 12 V
- # of Series LED: N =4
- # of Parallel Strings: M = 1
- LED operating point: VF(OP) = 2.75 V , IF(OP) = 95 mA
- Current limiting resistor: RLED = 3 Ω
- HHS Slew rate: SRON = 0.36 V/ µs
LED current in the string is shown in Figure 3-12 to Figure 3-14. As pulse-width decreases, either by increasing the PWM frequency or decreasing duty cycle, the LEDs spend less and less time of the output pulse above their forward voltage. In Figure 3-13, the diodes can no longer become forward biased during the ON pulse and stay off.
 Figure 3-12 TPS1HA08-Q1 Driving LED String
Sample Design, f = 1 kHz , D = 50%.
Figure 3-12 TPS1HA08-Q1 Driving LED String
Sample Design, f = 1 kHz , D = 50%.  Figure 3-13 TPS1HA08-Q1 Driving LED String
Sample Design, f = 1 kHz , D = 10%.
Figure 3-13 TPS1HA08-Q1 Driving LED String
Sample Design, f = 1 kHz , D = 10%.  Figure 3-14 TPS1HA08-Q1 Driving LED,
Insufficient Pulse-Width, f = 1.7 kHz , D = 10%.
Figure 3-14 TPS1HA08-Q1 Driving LED,
Insufficient Pulse-Width, f = 1.7 kHz , D = 10%. These results match the Cree model at input pulse widths of 50 µs. At 1 kHz and up, PWD was noticeably worse and would no longer conduct.


 Figure 3-15 Bench Results of 12-V, 500-mA
PWM Diode Load Over Frequency
Figure 3-15 Bench Results of 12-V, 500-mA
PWM Diode Load Over Frequency