SLVAET3 October 2021 TPS8802
- Trademarks
- 1Introduction
- 2System Architecture
- 3Current Consumption
- 4System Power Calculation and Measurements
- 5Summary
- 6References
4.2.2 Smoke and CO System Measurements
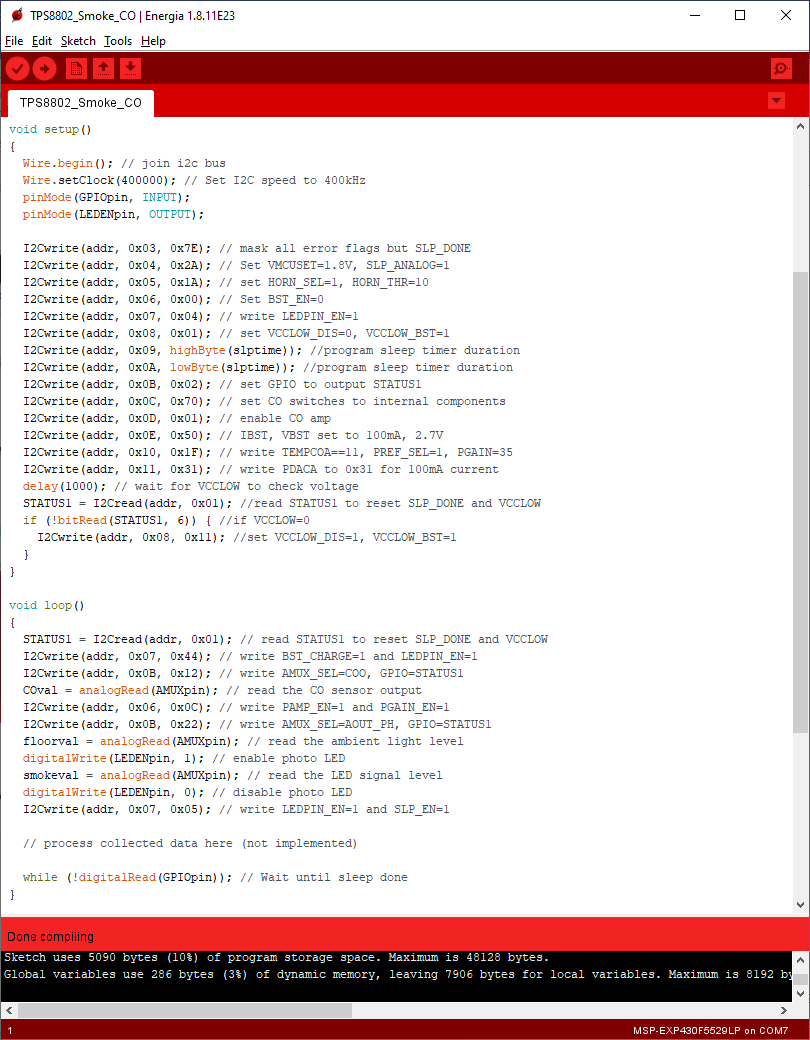 Figure 4-6 Energia Code Excerpt for
Taking Smoke and CO Measurements
Figure 4-6 Energia Code Excerpt for
Taking Smoke and CO MeasurementsThe smoke and CO measurement subroutine controls the TPS8802 and collects the data required to determine the smoke and CO concentration. Here the TPS8802 sleep timer is used to disable blocks in the TPS8802 and send a signal to the microcontroller to wake up. The VCCLOW monitor is read after all the registers are initialized to determine whether the VCCLOW monitor and VCCLOW_BST need to be active. If the VCCLOW status flag is low, the VCCLOW monitor is disabled. This implementation is used in place of a periodic battery check to simplify the power measurements. The waveforms verify that the Energia code is correctly written.
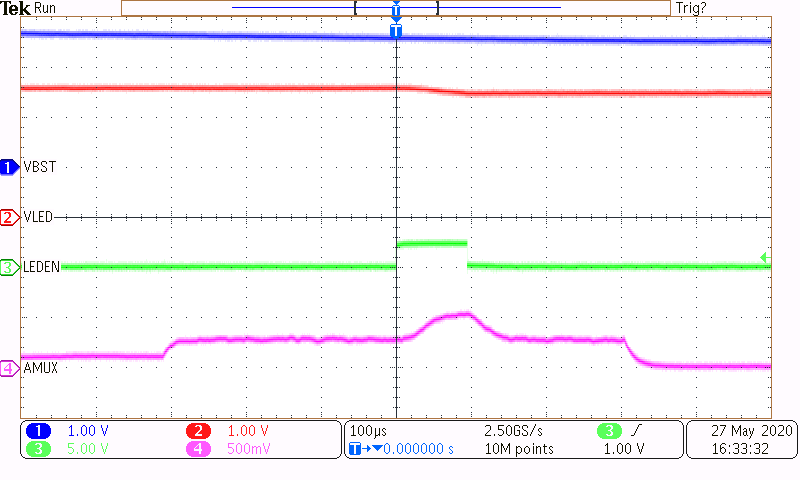 Figure 4-7 Smoke Measurement Signals
in the Smoke and CO System
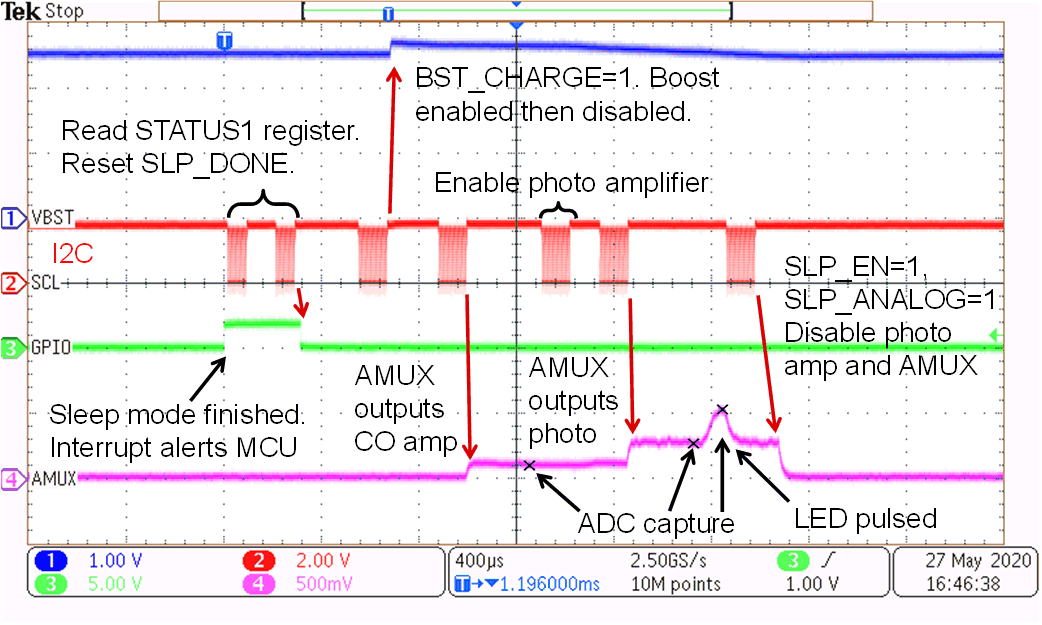 Figure 4-9 Power and Signal Waveforms
with VBAT=2.6 V
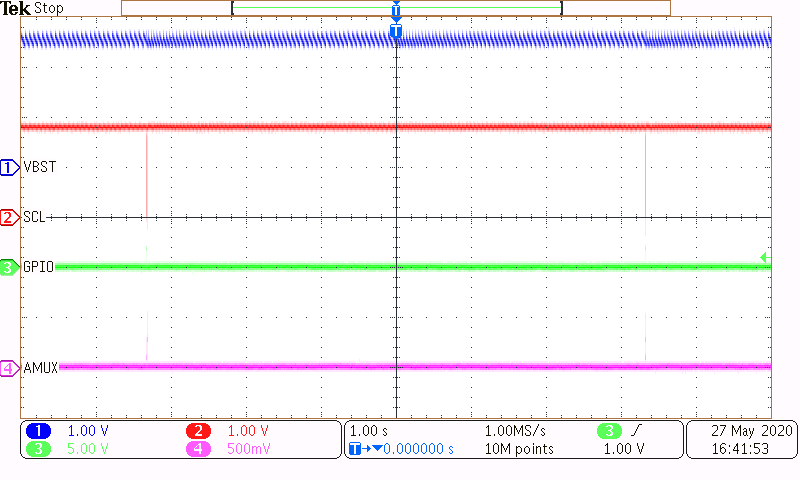 Figure 4-11 Multiple Smoke and CO
Measurements Waveforms with VBAT=2.0 V
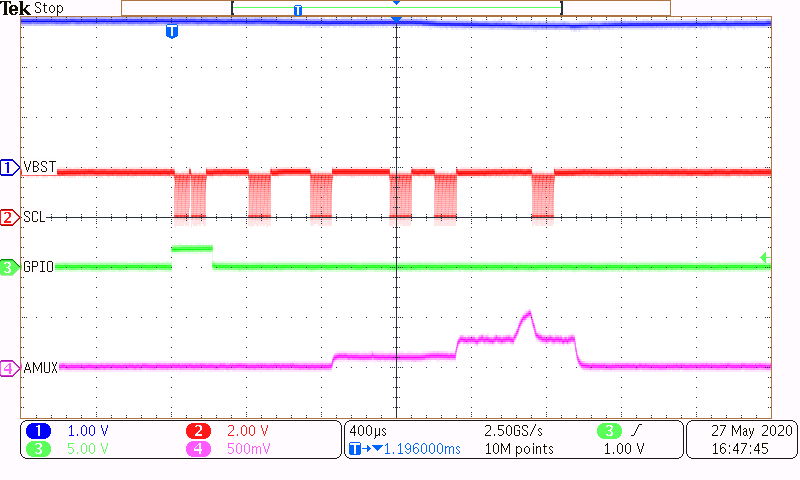 Figure 4-8 Power and Signal Waveforms
with VBAT=3 V
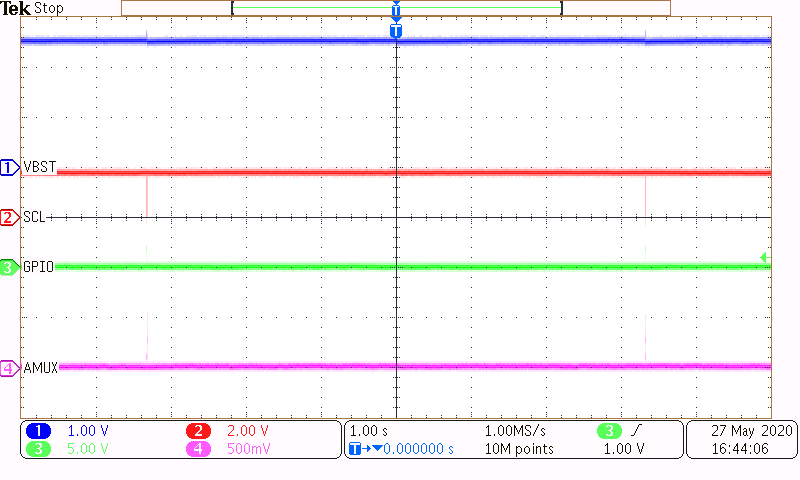 Figure 4-10 Multiple Smoke and CO
Measurements Waveforms with VBAT=2.6 V
Figure 4-10 Multiple Smoke and CO
Measurements Waveforms with VBAT=2.6 VThe supply current with the photoelectric sensor LED connected and disconnected is measured at three voltages, shown in Table 4-1. Four sets of measurements are taken at each condition, making the total measurement time 40 seconds for each condition. The photoelectric sensor LED is connected and disconnected to measure the current consumption caused by the LED. This provides more datapoints to correlate the measurements with the calculation.
The largest discrepancy between the measurement and calculation is 0.58 µA at the VBAT=2.0 V, LED on condition. The source of discrepancy was found to be caused by above-average currents for the TPS8802 standby, MCU LDO, and CO amplifier, totaling 0.48 µA. After adjusting the TPS8802 standby, MCU LDO, and CO amplifier currents in the calculation, the measurement much more closely matches the calculation. For this calculation, the MCU standby, MCU active, battery test, and user alarm test currents are set to zero because they are not implemented in the test system. The boost Schottky leakage is set to 4 µA in the calculation to match the Schottky diode leakage on the TPS8802EVM. The power consumption at lower voltages can be improved with a lower leakage Schottky diode.
The calculation accuracy verifies that the calculation can be modified to estimate the power consumption with different system specifications. The result of the power calculation with MCU currents, battery test currents, and user alarm test currents added is shown in Figure 4-1.
| Supply Voltage | VBAT = 3.0 V | VBAT = 2.6 V | VBAT = 2.0 V | ||||
| Condition | LED on | LED off | Standby + CO + MCU LDO | LED on | LED off | LED on | LED off |
| Measurement | 9.32 µA | 7.15 µA | 6.98 µA | 9.06 µA | 6.96 µA | 18.46 µA | 14.76 µA |
| Calculation | 8.86 µA | 6.61 µA | 6.50 µA | 9.42 µA | 6.67 µA | 17.88 µA | 14.31 µA |
| Adjusted Calculation | 9.34 µA | 7.09 µA | 6.98 µA | 9.90 µA | 7.15 µA | 18.64 µA | 15.07 µA |