SBOU278 December 2021
3.5.2 Feature Descriptions
Lux Plot
In the center of the GUI window you will see a plot showing the lux reading from the device on the y-axis and the sample number on the x-axis. The plot settings can be tweaked by right clicking on the plot. The x-axis and y-axis options under the right-click menu allow the range of x and y-axes displayed to be changed. There is also an auto option that will dynamically change the range to match the data. Scrolling will zoom in to or zoom out from the plot. Left-clicking and dragging will display a yellow rectangle that will, upon releasing the mouse, zoom the data to the rectangle drawn. Right-clicking and dragging up or down zooms the y-axis. Right-clicking and dragging right or left will zoom the x-axis. Right clicking and selecting View All will reset the view.
Drop-down Menus
At the top left of the plot are two drop-down menus.
The operation select drop-down menu allows device operating mode to be switched between power down and continuous capture modes. The one shot mode of the device is not exposed by the EVM GUI.
The mode select drop-down menu changes the device gain range setting mode. The device supports automatic gain control (ACG), which is the recommended mode setting for most use cases, or the gain range of the device can be selected manually using this drop-down menu.
The device supports twelve conversion times from 0.6 ms to 800 ms, which can be selected using the respective drop-down menu.
The display sample count selects how many samples are displayed on the x-axis of the plot.
Save to file
The set save to file name check box allows the data captured in the GUI to be dumped to a CSV file. Clicking this check box will display a windows file selector screen. Select the directory to store the CSV and set the name for the CSV. After clicking save the GUI will wait for you to click the start capture button to start saving data and subsequently it will wait for a click on the stop capture button to copy all the data into the indicated CSV file. When capturing data with save enabled, the GUI will initially dump the data to temporary .npy files. After clicking stop capture this data is written over to the CSV file and .npy files are removed.
Mean, Std, and the Blue Slider
There is a blue slider on the lux plot shown on the right side of the plot in the figure. Mean and Std columns in the table where capture data is displayed are calculated from only the data within the blue slider. Left-clicking on the middle of this slider and dragging moves the slider. Left-clicking on the edge of either side of the slider and dragging will adjust the size of the slider. This allows the mean and standard deviation of the distance, phase, and amplitude to be computed for any continuous portion of the displayed data. If capture is running, this data updates in real-time along with the data in the Live column.
Scripts Window
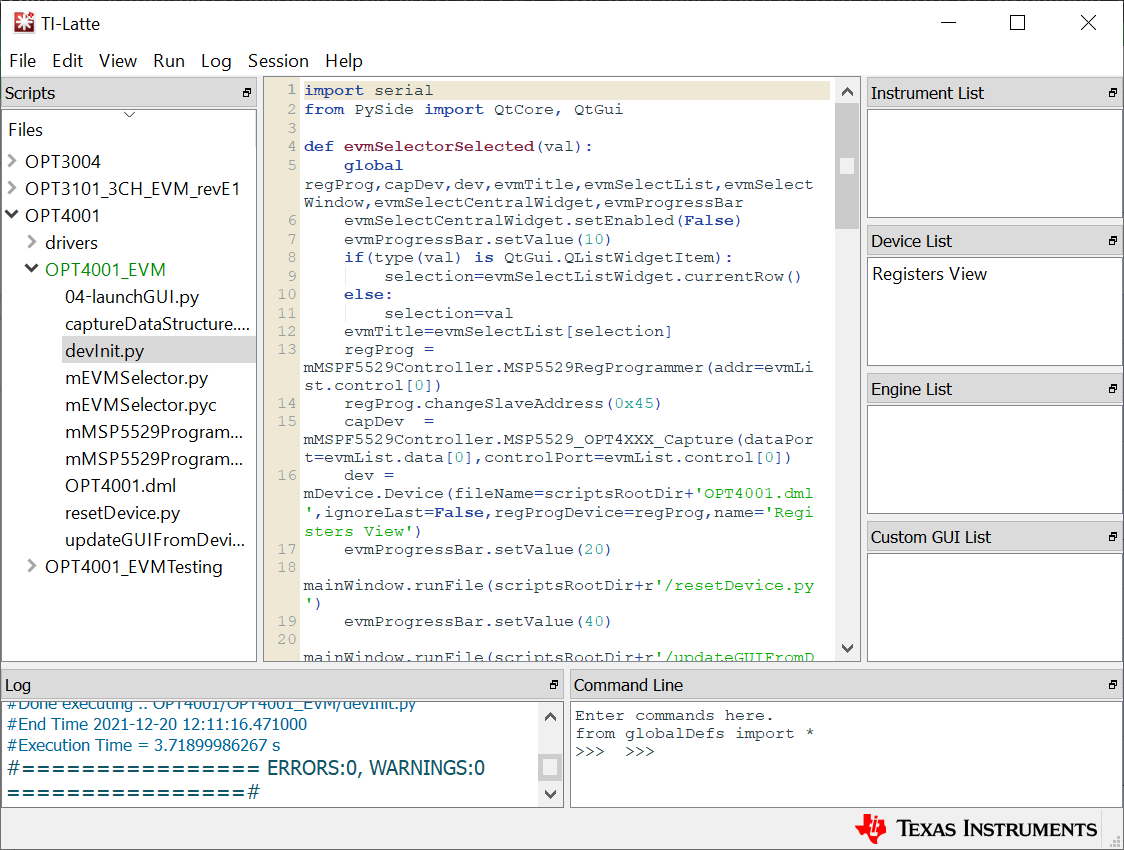
When Latte is launched, the GUI window appears front and center. However, there is a second window that is minimized at launch. This is the scripts window and it exposes some more advanced features of the Latte platform as shown in Figure 3-14.
 Figure 3-14 Latte Scripts Window
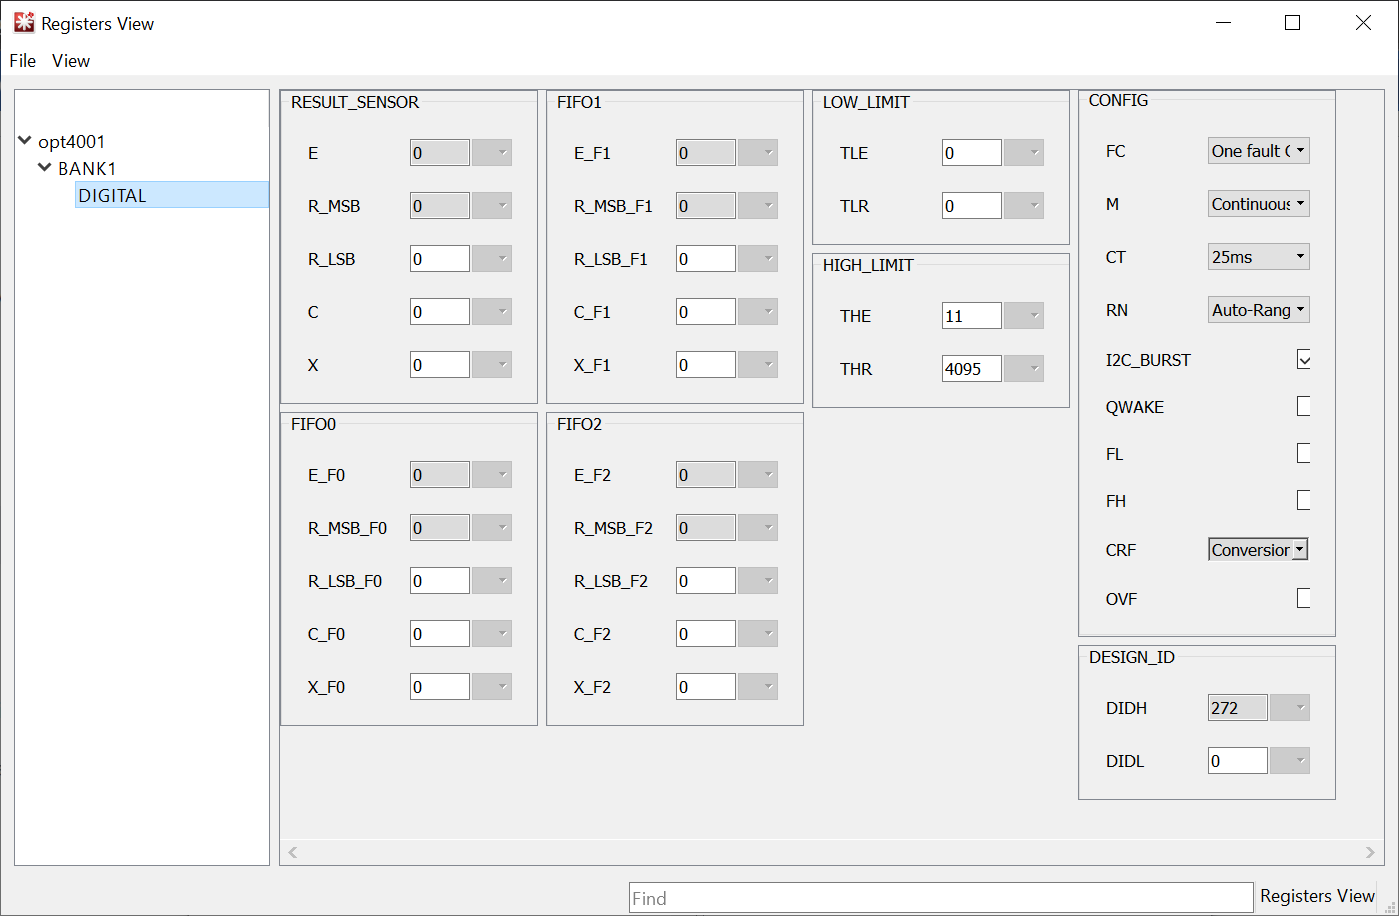
The scripts window also provides access to the device registers view that displays the stored value of the device registers and allows them to be changed directly. Launch the registers view by double clicking on the Registers View button under the Device List box on the right side of the screen.
 Figure 3-15 Registers View
Overview of Device Registers
Registers x00 and 0x01 are the result registers and provide the output data from the device as an exponent and mantissa value indicated as e and r in the register view. The mantissa is split between registers 0x00 and 0x01 as R_MSB and R_LSB. A sample counter (C) and CRC check bits (X) are also contained in register 0x01.
Registers 0x0A, 0x0B, and 0x0C are the configuration registers and provide feedback about the state of the device; the bit names and full descriptions are shown in the OPT4001 data sheet. Each of the read-only status bits are greyed out and cannot be changed.
Registers x08 and x09 allow low and high limits, respectively, to be set. These registers are used in certain interrupt reporting modes.
The device ID is contained in register 0x11.
Additional Features of the Scripts Window
Hidden IDE Window
The Latte program runs a number of Python scripts in the background to capture and display data from the EVM. These scripts allow for initialization of the device including loading calibration data from the EVM flash memory, launching a live view window with measurement plot and readings, and additional functionality such as reading from the flash and selecting a specific LED current for the device to use. For advanced users or users looking for more flexibility when using the OPT3101EVM, these Python scripts are available in an integrated development environment (IDE) window that is minimized when TI-Latte is launched. The IDE window can be used to customize the existing scripts or write new scripts.
After launching Latte, expand the OPT4001YMN directory on the left side of the window under Files by clicking the triangle to the left of the directory name. This displays the OPT4001YMNEVM folder. Further expanding the OPT4001YMNEVM folder will display all the example scripts as shown in Figure 3-14.
devInit.py
Open the devInit.py script by clicking on the corresponding file in the OPT4001YMNEVM folder on the left side of the screen. This displays the contents of the script on the center of the window. With devInit.py still selected in TI-Latte, click Run>Buffer from the top menu bar of TI-Latte (or press F5) to run the script. Once completed, the live-view GUI is opened in a new window. More details on the live-view GUI are given in the following section. Additional info is also displayed in the log window in the lower left corner of the main window.
04-launchGUI.py
A live-view GUI window is launched when running the devInit.py script. This allows data from the OPT4001 to be viewed on a graph in real-time. The GUI is created in the launchGUI.py example script. When running devInit.py, the launchGUI.py script is automatically ran. However, if the GUI window is closed it can be re-launched by directly running the launchGUI.py script. To do this, select the launchGUI.py script and click Run>Buffer or press F5. Figure 3-13 shows the live GUI plot.