ZHCSEO0B February   2016  – April 2018 CSD87335Q3D

PRODUCTION DATA.  

  1. 1特性
  2. 2应用
  3. 3说明
    1.     俯视图
      1.      Device Images
  4. 4修订历史记录
  5. 5Specifications
    1. 5.1 Absolute Maximum Ratings
    2. 5.2 Recommended Operating Conditions
    3. 5.3 Thermal Information
    4. 5.4 Power Block Performance
    5. 5.5 Electrical Characteristics
    6. 5.6 Typical Power Block Device Characteristics
    7. 5.7 Typical Power Block MOSFET Characteristics
  6. 6Applications and Implementation
    1. 6.1 Application Information
      1. 6.1.1 Equivalent System Performance
    2. 6.2 Power Loss Curves
    3. 6.3 Safe Operating Curves (SOA)
    4. 6.4 Normalized Curves
    5. 6.5 Calculating Power Loss and SOA
      1. 6.5.1 Design Example
      2. 6.5.2 Calculating Power Loss
      3. 6.5.3 Calculating SOA Adjustments
  7. 7Recommended PCB Design Overview
    1. 7.1 Electrical Performance
    2. 7.2 Thermal Performance
  8. 8器件和文档支持
    1. 8.1 接收文档更新通知
    2. 8.2 社区资源
    3. 8.3 商标
    4. 8.4 静电放电警告
    5. 8.5 Glossary
  9. 9机械、封装和可订购信息
    1. 9.1 Q3D 封装尺寸
    2. 9.2 焊盘布局建议
    3. 9.3 模板建议
    4. 9.4 Q3D 卷带信息
    5. 9.5 引脚配置

封装选项

机械数据 (封装 | 引脚)
散热焊盘机械数据 (封装 | 引脚)
订购信息

Normalized Curves

The normalized curves in the CSD87335Q3D data sheet provides guidance on the power loss and SOA adjustments based on their application specific needs. These curves show how the power loss and SOA boundaries will adjust for a given set of systems conditions. The primary Y-axis is the normalized change in power loss and the secondary Y-axis is the change in system temperature required in order to comply with the SOA curve. The change in power loss is a multiplier for the power loss curve and the change in temperature is subtracted from the SOA curve.
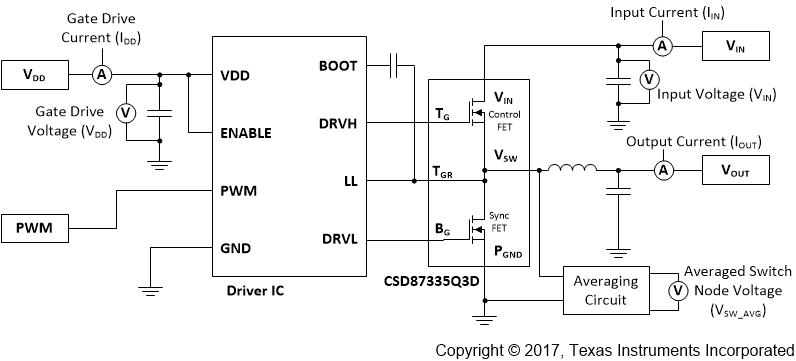
CSD87335Q3D SLPS574_Typical_App.gifFigure 31. Typical Application