ZHCU831 November 2021 AWR2944 , IWR2944
3.1.2 Software and GUI
Associated software is hosted on the TI Resource Explorer Automotive Toolbox.
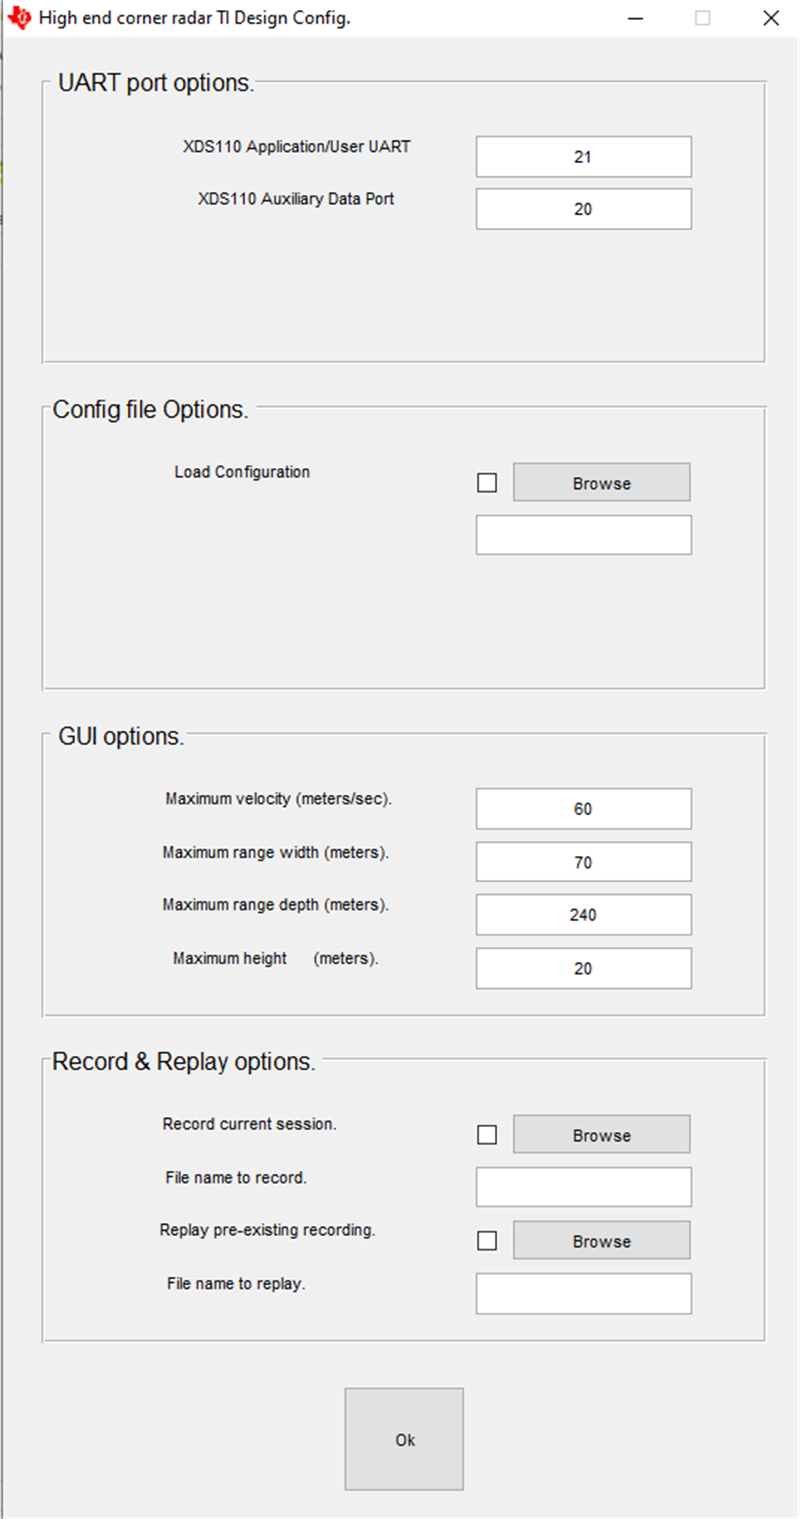
The demo GUI is configured as shown in Figure 3-1.
The first window of the GUI tool allows the user to configure the demo. In the first tab, (UART port options), UART ports are configured based on the device manager settings. Loading the configuration file is optional in the second tab, if the user needs to change some inbuilt configuration of the default application. The third tab configures the ranges on the GUI, it only configures the GUI and not the radar. The final tab has a list of record and replay options that allow the recording of and then replaying of UART recordings.

Figure 3-1 GUI Front Page Screen
The default GUI starts as soon as the OK button is clicked.
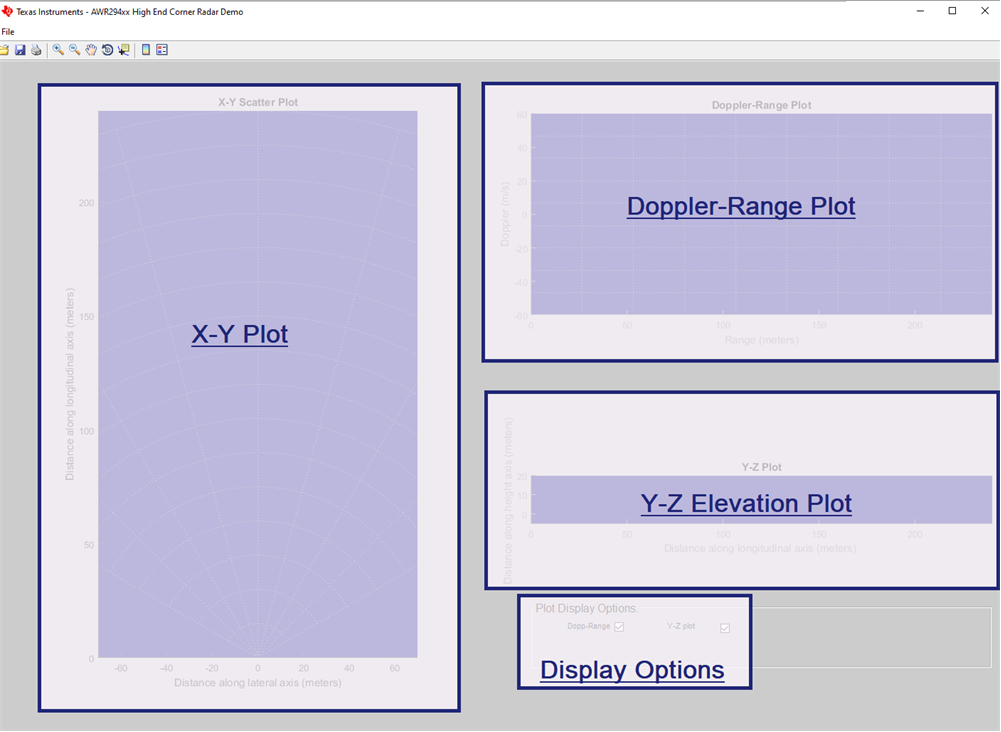
See Figure 3-2 for a screenshot of the GUI with the different components labeled.

Figure 3-2 GUI Plot Screen
The MATLAB® GUI consists of five components:
- X-Y scatter plot: displays the positions of the point clouds, the tracks
- Y-Z plot: displays the elevation in formation of the detected object
- Doppler range plot: displays the Doppler-range coordinates of the point cloud and tracks
- Display options to hide some of the plot if Visualizer lags to plot the point clouds.