TIDUEX1A December 2020 – March 2021
3.3.2 Test Results
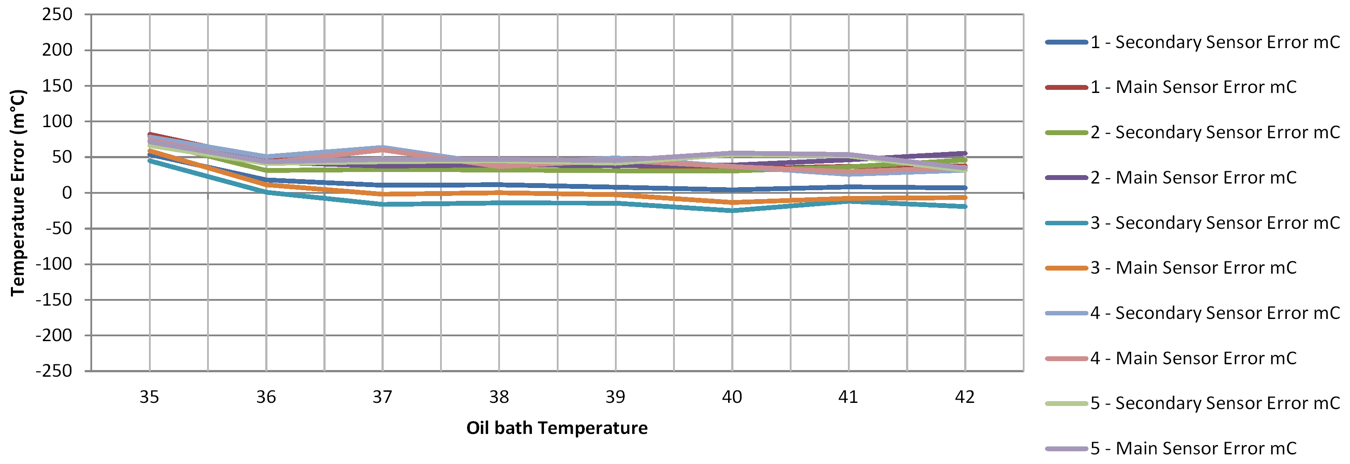
In total, 5 strips were tested for accuracy within the liquid oil-bath. The results are shown in Figure 3-16. The strips were assessed to be well within the accuracy specifications with no additional calibration applied. For finished products packaging must be included during accuracy testing to ensure total system accuracy.
 Figure 3-16 Accuracy Test Results
Tympanic Thermometer vs. Hearable Design
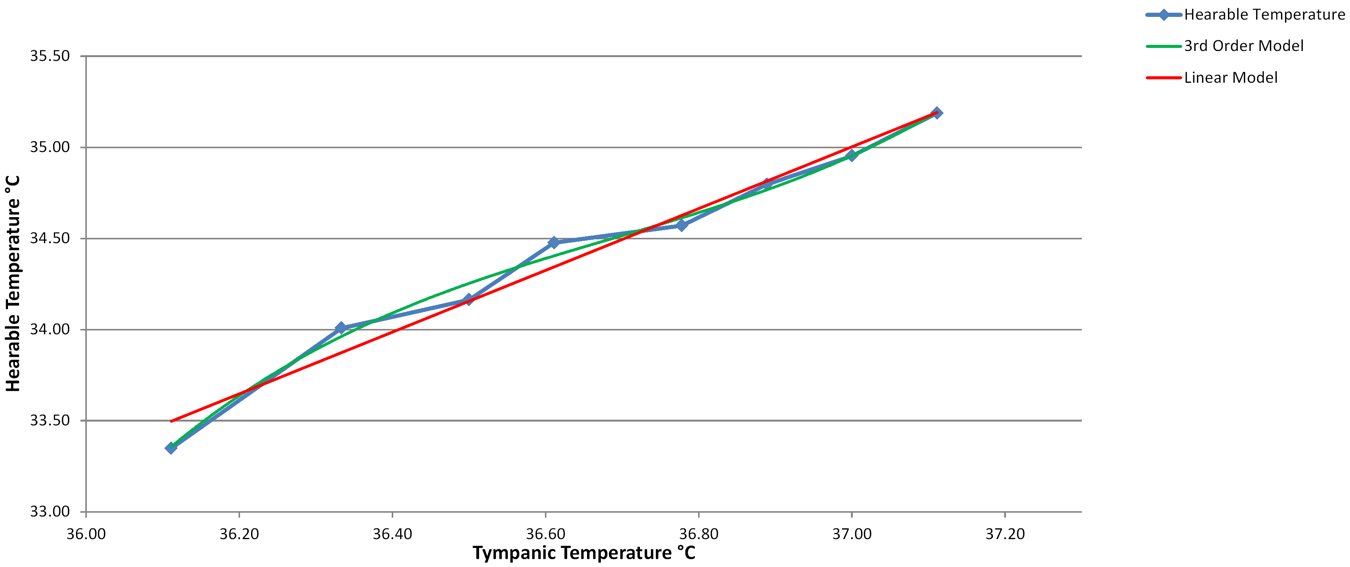
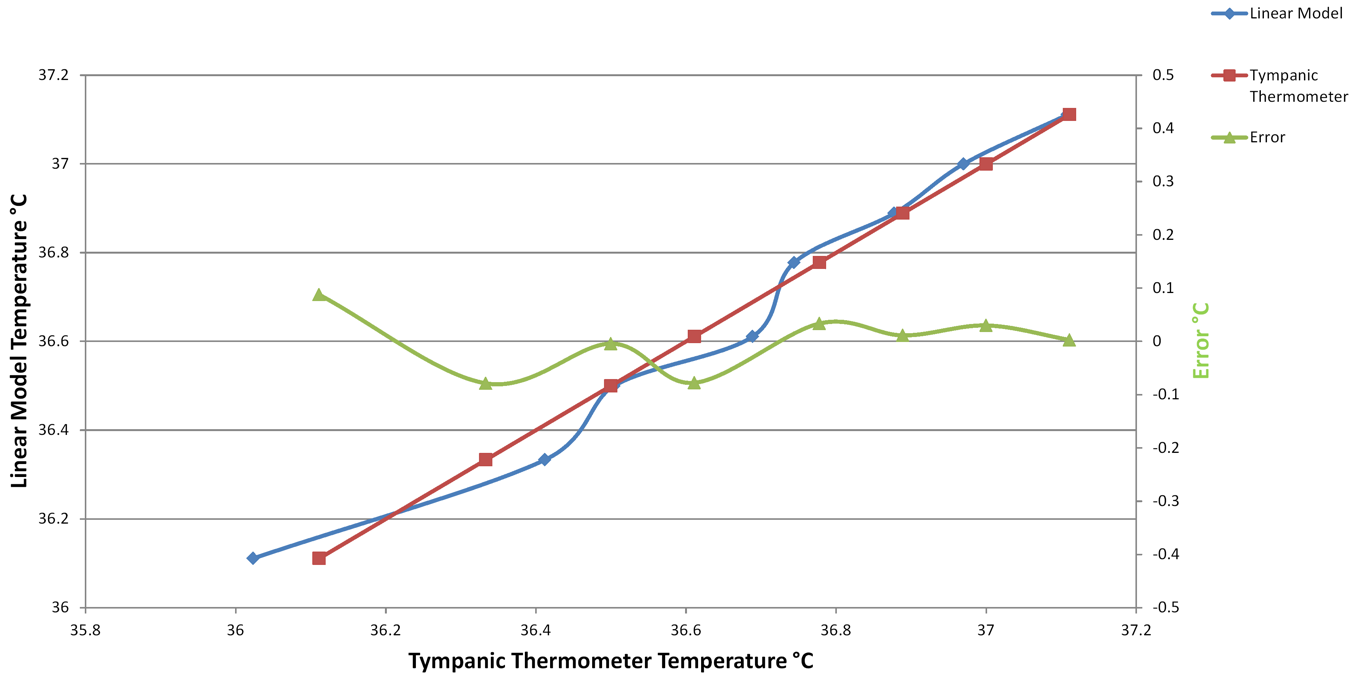
Core body temperature data was collected using the hearable reference design and compared to temperature data collected by a commercial tympanic thermometer. First, the hearable reference design was placed in a closed earbud casing. The casing was then placed inside the subject's ear across the normal human body temperature range. After the temperature reading settled, a tympanic thermometer was used to get a reference temperature.The data was then correlated using a linear fit model and 3rd order polynomial model. The linear fit model resulted in an error between ±0.1 °C across the temperature range and correlated the two temperature readings with an R2 value of 0.9738. Figure 3-17 shows the fit models used to correlate the two temperature sets. Figure 3-18 shows the temperature error between the two sets using the linear model.
 Figure 3-17 Hearable Design Temperature vs.
Tympanic Thermometer
 Figure 3-18 Linear Model vs .Tympanic Thermometer
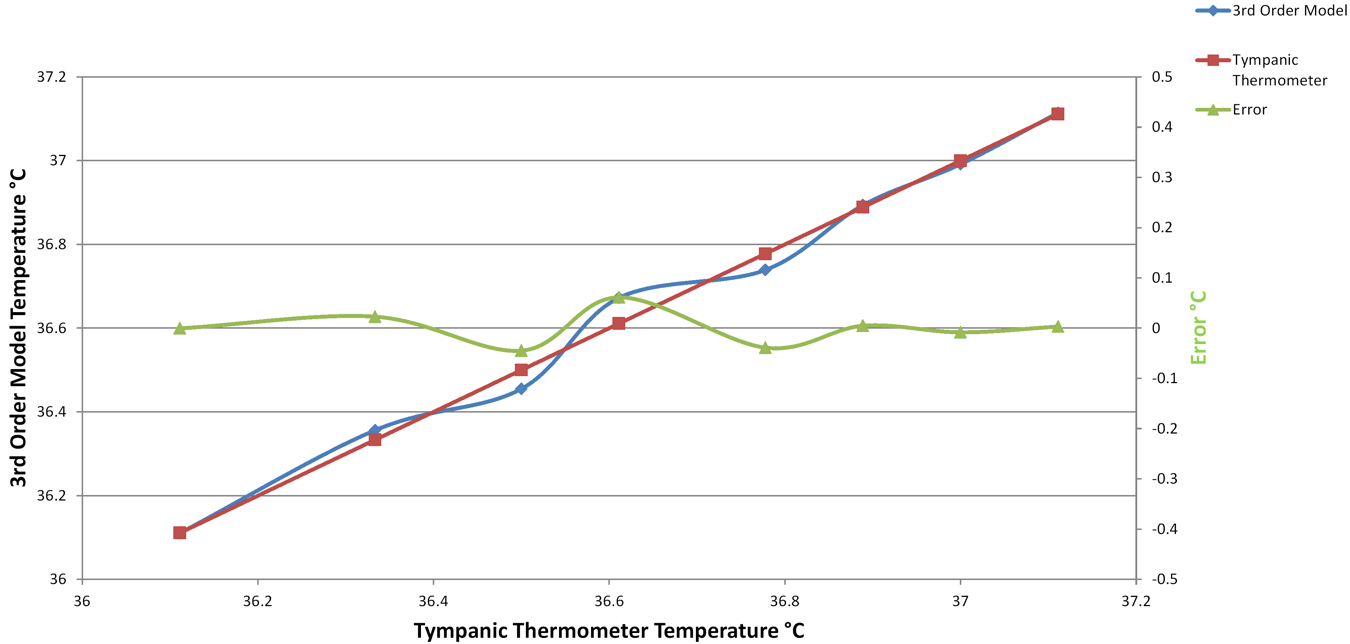
Similarly, the 3rd order polynomial model resulted in an error between ±0.075 °C across the temperature range and correlated the two temperature readings with an R2 value of 0.9925. Figure 3-19 shows the temperature error between the two sets using the 3rd order model.
 Figure 3-19 3rd Order Model vs. Tympanic
Thermometer