SLAA517F May 2012 – August 2021 MSP430F6720A , MSP430F6720A , MSP430F6721A , MSP430F6721A , MSP430F6723A , MSP430F6723A , MSP430F6724A , MSP430F6724A , MSP430F6725A , MSP430F6725A , MSP430F6726A , MSP430F6726A , MSP430F6730A , MSP430F6730A , MSP430F6731A , MSP430F6731A , MSP430F6733A , MSP430F6733A , MSP430F6734A , MSP430F6734A , MSP430F6735A , MSP430F6735A , MSP430F6736 , MSP430F6736 , MSP430F6736A , MSP430F6736A
4.3.3 Frequency Measurement and Cycle Tracking
The instantaneous I and V signals for each phase are accumulated in 48 bit registers. A cycle tracking counter and sample counter keep track of the number of samples accumulated. When approximately one second’s worth of samples have been accumulated, the background process stores these 48-bit registers and notifies the foreground process to produce the average results like RMS and power values. Cycle boundaries to trigger the foreground averaging process are used since it gives very stable results.
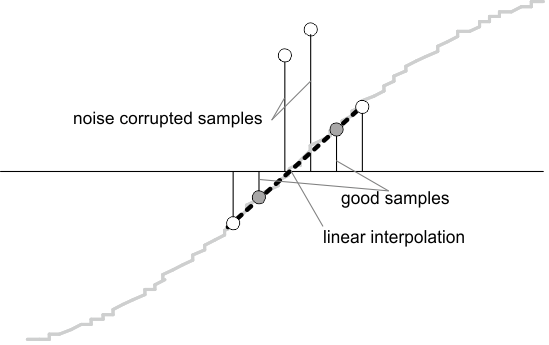
For frequency measurements, a straight line interpolation is created between the zero crossing voltage samples. Figure 4-4 depicts the samples near a zero cross and the process of linear interpolation.
 Figure 4-4 Frequency Measurement
Because noise spikes can also cause errors, therefore, the rate of change check to filter out the possible erroneous signals is used and make sure that the two points interpolated from are genuine zero crossing points. For example, if you have two negative samples, a noise spike can make one of them positive and therefore making the negative and positive pair looks as if there is a zero crossing.
The resultant cycle to cycle timing goes through a weak low pass filter to further smooth out cycle to cycle variations. This results in a stable and accurate frequency measurement tolerant of noise.