SLAK024A January 2019 – March 2024 TPS73801-SEP
- 1
- Abstract
- Trademarks
- 1Overview
- 2Single-Event Effects
- 3Test Device and Evaluation Board Information
- 4Irradiation Facility and Setup
- 5Test Setup and Procedures
- 6Single-Event-Burnout (SEB) and Single-Event-Latch-up (SEL)
- 7SET Results
- 8Summary
- A Confidence Interval Calculations
- B References
- C Revision History
7 SET Results
SETs were defined as heavy-ion-induced transients on the VOUT of the TPS73801-SEP that were higher than ±5% of the nominal voltage. Characterization was conducted at output voltages of 2.5V and 12V. For each VOUT load of 1A, 50mA was used.
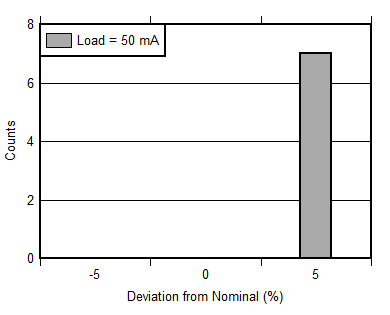
Table 7-1 summarizes the test conditions of the TPS73801-SET characterization. Flux of 105 ions / cm2-s and fluences up to 107 ions / cm2 were used for the SET data collection. To capture the transients, window triggers with ±5% around the nominal voltage were used for all runs. Note that for each summary table, the last column represents the case by case upper bound cross section. However Table 7-3 summarizes the upper bound cross section by output voltage and LET when the events and fluence are combined. The cross sections were calculated using the MTBF method shown in Appendix A, at 95% confidence interval. Table 7-1 show the seven upsets on run number 10. As shown in Table 7-1, the SETs are bipolar transitions around the nominal voltage. A histogram showing the deviation from the nominal voltage (VOUT = 2.5V) in percentage is shown in Figure 7-1.
Note that VOUT = 2.5V is the worst case since the ±5% threshold is a smaller value when compared with the other (higher) output voltages used for the characterization. Transients have a longer duration at light load versus heavy loads. Time domain plots of the SETs are shown in Figure 7-2.
| Run Number | Unit Number | Load (A) | LETEFF (MeV-cm2 / mg) | Ion | Angle | Flux (Ions / cm2 × s) | Fluence (Total Number of Ions) | Number of Events Less Than 5% of Nominal VOUT | σPERCASE (cm2 / device) |
|---|---|---|---|---|---|---|---|---|---|
| 8 | 1 | 1 | 43 | Ag | 0 | 1.00E+05 | 1.00E+07 | 0 | 3.69E-07 |
| 9 | 1 | .05 | 43 | Ag | 0 | 1.00E+05 | 1.00E+07 | 0 | 3.69E-07 |
| 10 | 1 | .05 | 43 | Ag | 0 | 1.00E+05 | 1.00E+07 | 7 | 1.44E-06 |
| 19 | 1 | 1 | 29.9 | Cu | 45 | 1.00E+05 | 1.00E+07 | 0 | 3.69E-07 |
| 20 | 1 | .05 | 29.9 | Cu | 45 | 1.00E+05 | 1.00E+07 | 0 | 3.69E-07 |
| 21 | 1 | .05 | 29.9 | Cu | 45 | 1.05E+05 | 1.00E+07 | 0 | 3.69E-07 |
| 22 | 1 | .05 | 20.1 | Cu | 0 | 1.05E+05 | 1.00E+07 | 0 | 3.69E-07 |
| 23 | 1 | .05 | 20.1 | Cu | 0 | 1.05E+05 | 1.00E+07 | 0 | 3.69E-07 |
| 25 | 3 | .05 | 20.1 | Cu | 0 | 1.05E+05 | 1.00E+07 | 0 | 3.69E-07 |
| 26 | 3 | .05 | 20.1 | Cu | 0 | 1.05E+05 | 1.00E+07 | 0 | 3.69E-07 |
| 27 | 3 | .05 | 20.1 | Cu | 0 | 1.05E+05 | 1.00E+07 | 0 | 3.69E-07 |
| Run Number | Unit Number | Load (A) | LETEFF (MeV-cm2/mg) | Ion | Angle | Flux | Fluence | Number of Events > 5% of Nominal VOUT | σPERCASE (cm2/ device) |
|---|---|---|---|---|---|---|---|---|---|
| 15 | 2 | .05 | 48.47 | Ag | 0 | 1.00E+05 | 1.00E+07 | 0 | 3.69E-07 |
| 16 | 2 | 1 | 48.47 | Ag | 0 | 1.00E+05 | 1.00E+07 | 0 | 3.69E-07 |
| 17 | 2 | 1 | 28.9 | Cu | 45 | 1.00E+07 | 1.00E+07 | 0 | 3.69E-07 |
| 18 | 2 | .05 | 28.9 | Cu | 45 | 1.00E+05 | 1.00E+07 | 0 | 3.69E-07 |
| Vin (V) | Vout (V) | Load (A) | LETEFF (MeV × cm2/mg) | Fluence (Number of ions / cm2) | Total Number of Events | σCOMBINED (cm2) |
|---|---|---|---|---|---|---|
| 15 | 12 | 0 to 1 | 43 | 2.00E+07 | 0 | 1.84E-07 |
| 5 | 2.5 | 0 to 1 | 43 | 3.00E+07 | 7 | 4.81E-07 |
| 5 | 2.5 | 0 to 1 | 28.9 | 3.00E+07 | 0 | 1.23E-07 |
| 5 | 2.5 | 0 to 1 | 20.1 | 5.00E+07 | 0 | 7.38E-08 |
 Figure 7-1 Histogram of the Deviation from Nominal Voltage for the SETs
Figure 7-1 is based on the seven upsets greater than ±5% of nominal VOUT = 2.5V.
 Figure 7-2 Transient Events on VOUT