TIDUEM8B March 2019 – February 2021
3.2.1.3.1 Viewing Results From LCD
The LCD scrolls between metering parameters every two seconds. For each metering parameter that is displayed on the LCD, three items are usually displayed on the screen: a symbol used to denote the phase of the parameter, text to denote which parameter is being displayed, and the actual value of the parameter. The phase symbol is displayed at the top of the LCD and denoted by a triangle shape. The orientation of the symbol determines the corresponding phase. Figure 3-7 and Figure 3-8 show the mapping between the different orientations of the triangle and the phase descriptor:
 Figure 3-7 Symbol for Phase A
 Figure 3-8 Symbol for Phase B
Aggregate results (such as cumulative active and reactive power) and parameters that are independent of phase (such as time and date) are denoted by clearing all of the phase symbols on the LCD.
The bottom line of the LCD is used to denote the value of the parameter being displayed. The text to denote the parameter being shown displays on the top line of the LCD. Table 3-2 shows the different metering parameters that are displayed on the LCD and the associated units in which they are displayed. The designation column shows which characters correspond to which metering parameter.
| PARAMETER NAME | DESIGNATION | UNITS | COMMENTS |
|---|---|---|---|
| Active power |  | Watt (W) | This parameter is displayed for each phase. The aggregate active power is also displayed. |
| Reactive power |  | Volt-Ampere Reactive (var) | This parameter is displayed for each phase. The aggregate reactive power is also displayed. |
| Apparent power |  | Volt-Ampere (VA) | This parameter is displayed for each phase. |
| Power factor |  | Constant between 0 and 1 | This parameter is displayed for each phase. |
| Voltage |  | Volts (V) | This parameter is displayed for each phase. |
| Current | 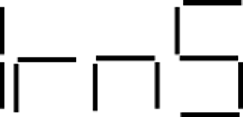 | Amps (A) | This parameter is displayed for each phase. |
| Frequency |  | Hertz (Hz) | This parameter is displayed for each phase. |
| Total consumed active energy |  | kWh | This parameter is displayed for each phase. |
| Total consumed reactive energy |  | kVarh | This parameter is displayed for each phase. This displays the sum of the reactive energy in quadrant 1 and quadrant 4. |
| Time |  | Hour:minute:second | This parameter is only displayed when the sequence of aggregate readings are displayed. This parameter is not displayed once per phase. |
| Date |  | Year:month:day | This parameter is only displayed when the aggregate readings are displayed. This parameter is not displayed once per phase. |
Figure 3-9 shows an example of the measured frequency of phase A of 59.99 Hz, displayed on the LCD.
 Figure 3-9 LCD