TIDT375 December 2023
2.1 Efficiency Graphs
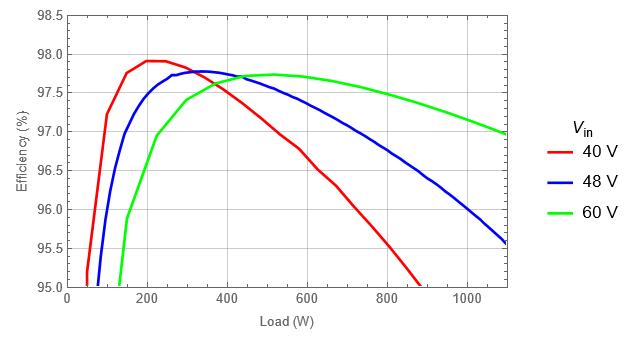
Figure 3-10 shows efficiency across the input operating voltage range. The peak efficiency is just under 98% while the full load 12-V efficiency is above 95.5%. Efficiency was measured on the test fixture. Actual module efficiency is higher due to additional loss present in the test fixture.
 Figure 2-1 Efficiency Graph