SWRU556 June 2021 CC3100 , CC3200
7.3 GUI RX Testing
RX testing is used for gathering Wi-Fi statistics in the air within a specified channel in case of external antenna. While using RF connector for accurate RF tests the packets will be accepted by the RF connected path.
Duration: Statistics gathering time can be specified with a fixed duration, or 0 to make the testing time indefinite, until you press the STOP button. Statistics are gathered automatically whenever the RX testing is stopped. However, users may choose to gather the statistics any time before RX testing ends by clicking the Get Statistics button. Table 7-3 lists fields explanations.
| Field | Description |
|---|---|
| Valid | Valid packets |
| Addr Mismatch | Packets with address mismatch |
| FCS Error | Frame Check Sequence error |
| Mang frame | Average RSSI in management frames |
| DataCtrl frame | Average RSSI in Data Control frames |
Figure 7-3 lists the Radio Tool GUI in the RX Tab.
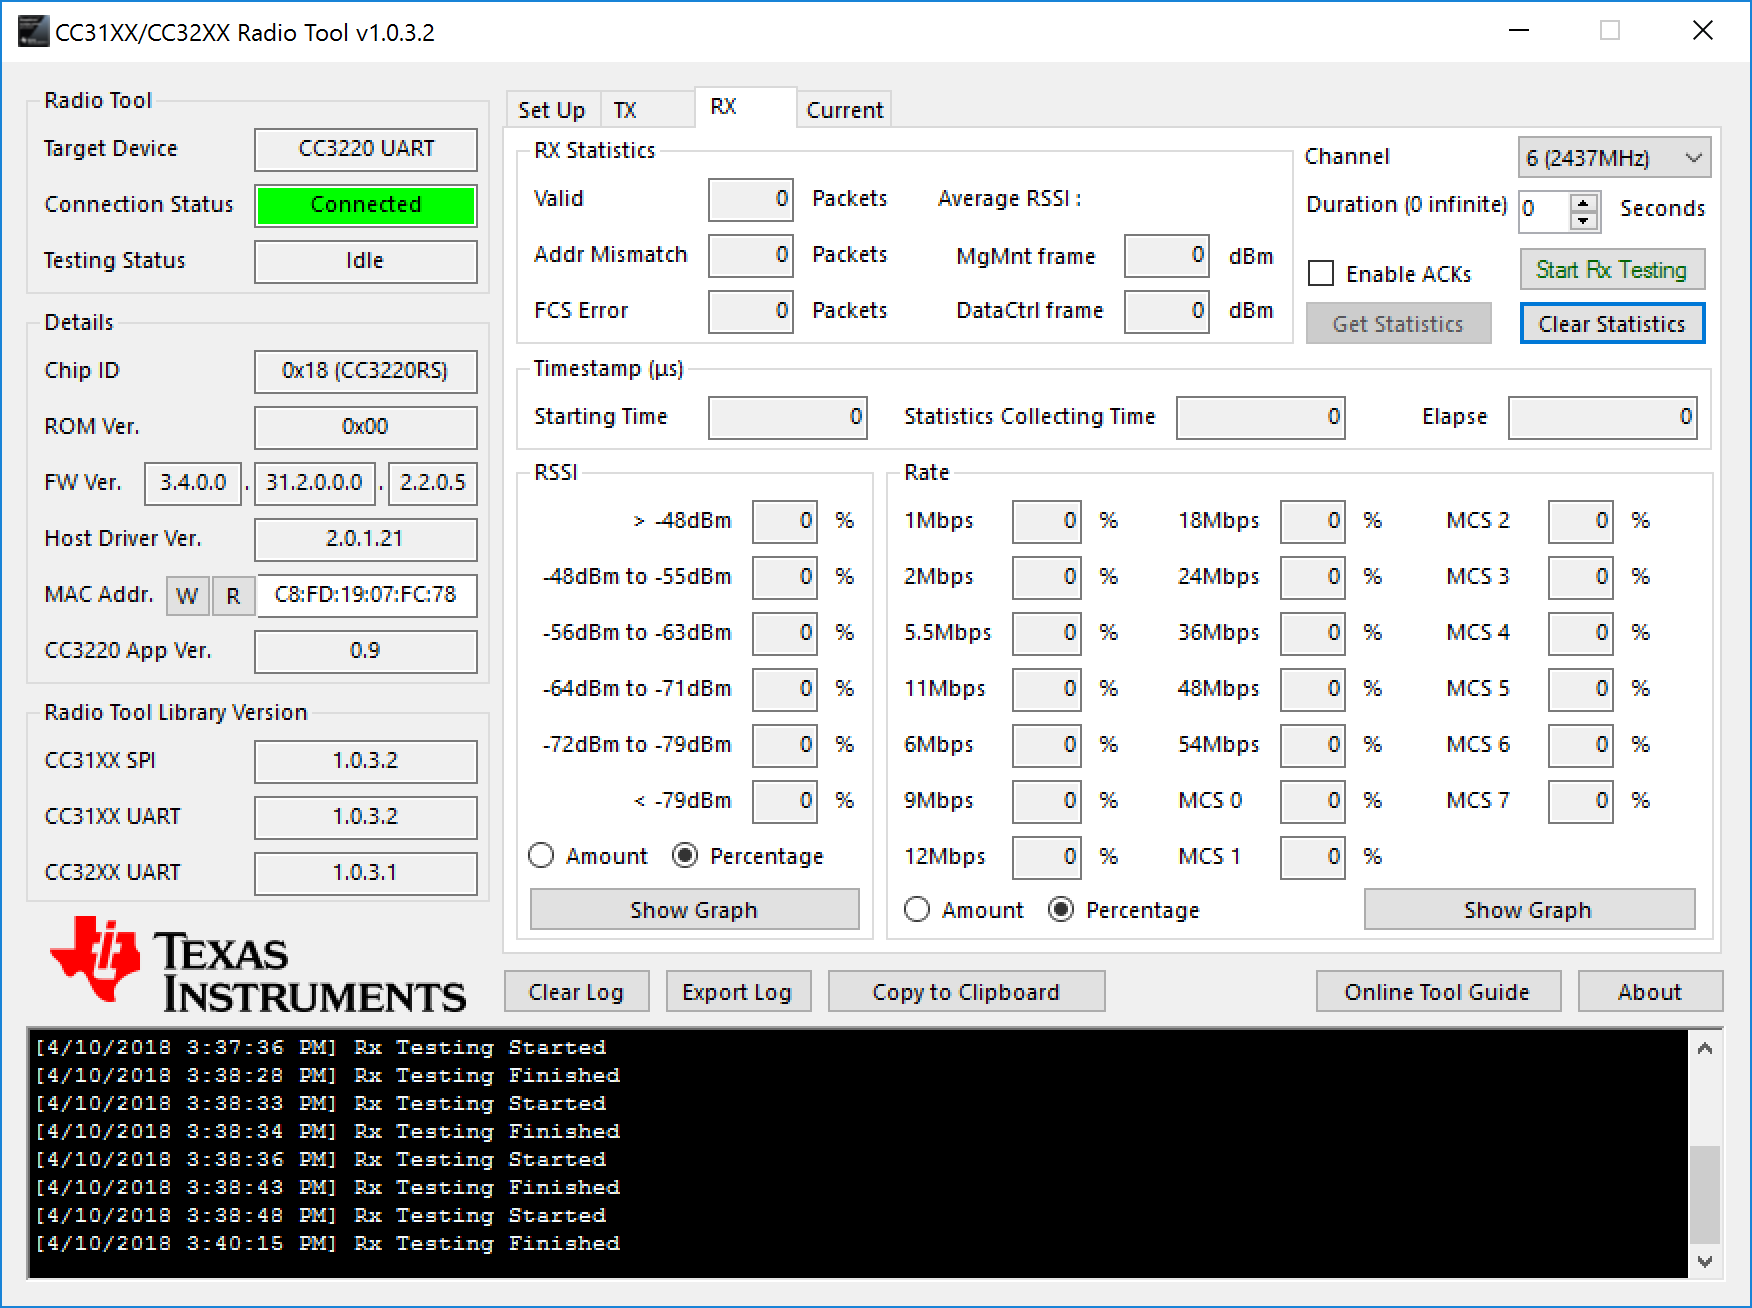 Figure 7-3 Radio Tool GUI in RX
Tab
Figure 7-3 Radio Tool GUI in RX
TabFigure 7-4 lists the Radio Tool GUI in the RX Tab with Running in Progress.
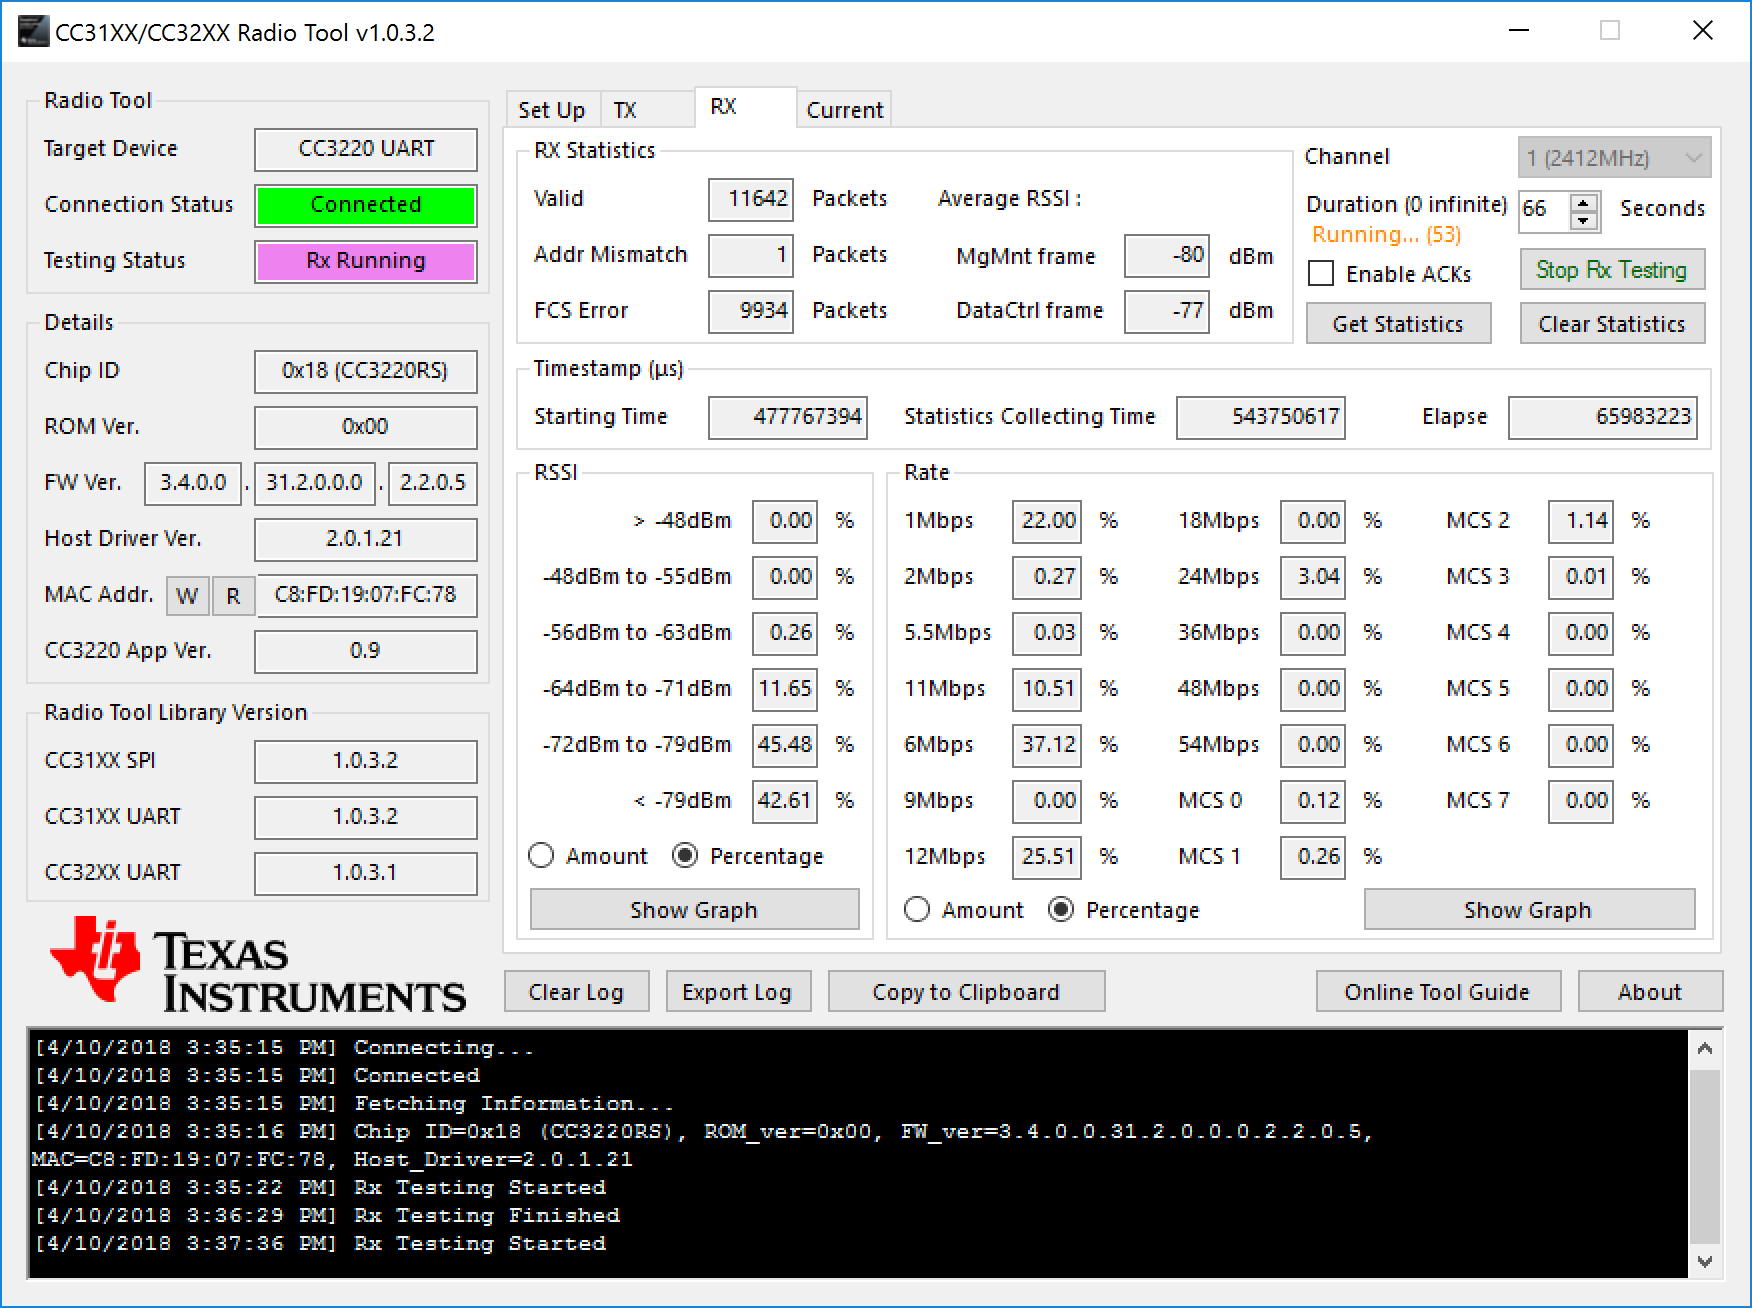 Figure 7-4 Radio Tool GUI in RX Tab With
Running in Progress
Figure 7-4 Radio Tool GUI in RX Tab With
Running in ProgressFigure 7-5 shows gathered statistics. Rates and RSSIs are displayed as percentages.
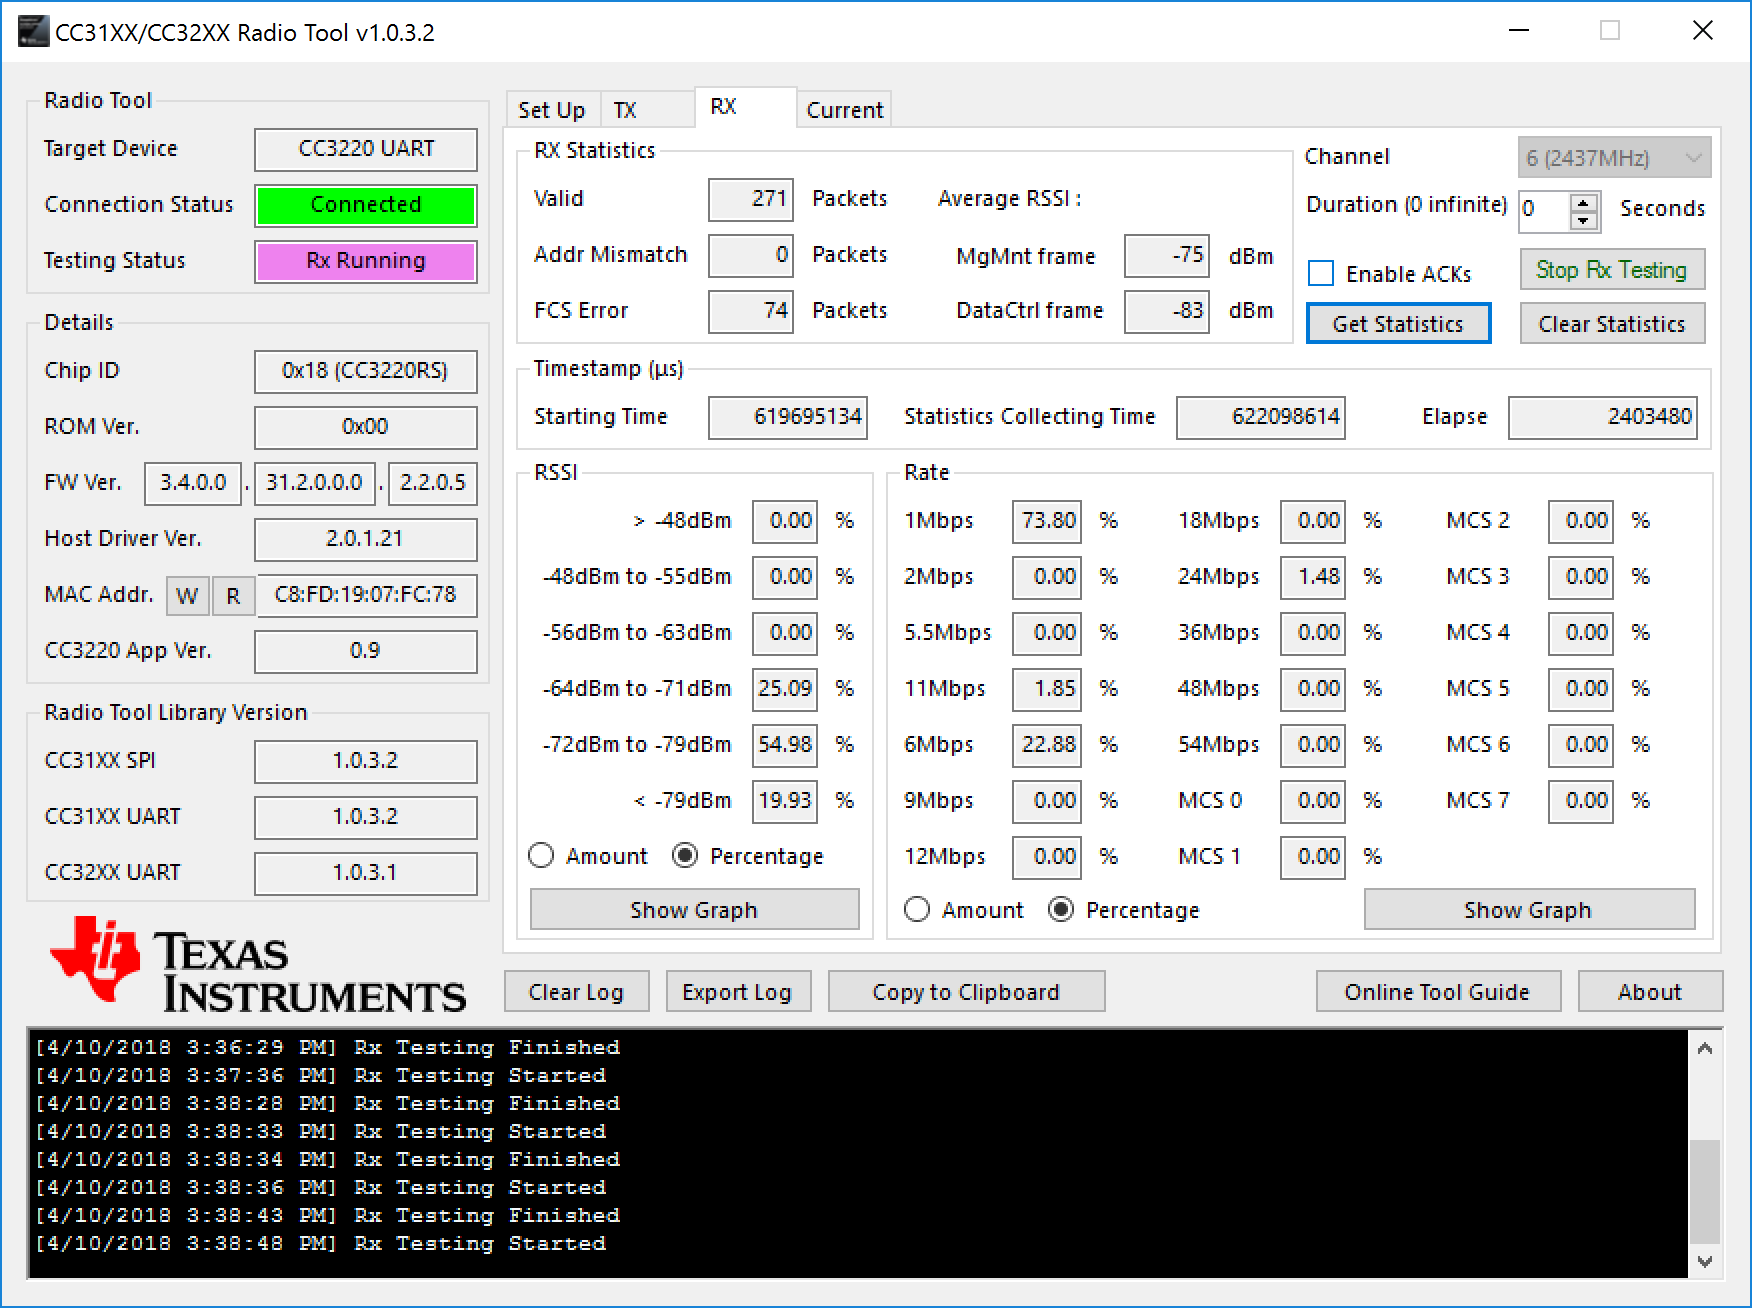 Figure 7-5 Radio Tool GUI in RX Tab With
Statistics
Figure 7-5 Radio Tool GUI in RX Tab With
StatisticsYou can also click on the Show Graph buttons to show a bar graph representation of rates or RSSI.
Figure 7-6 shows the RSSI histogram graph in amounts.
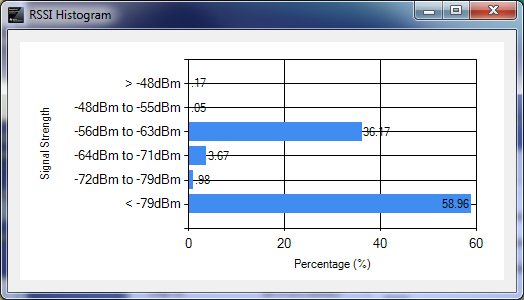 Figure 7-6 RSSI Histogram Graph in
Amount
Figure 7-6 RSSI Histogram Graph in
AmountFigure 7-7 shows the rate histogram graph in percentages.
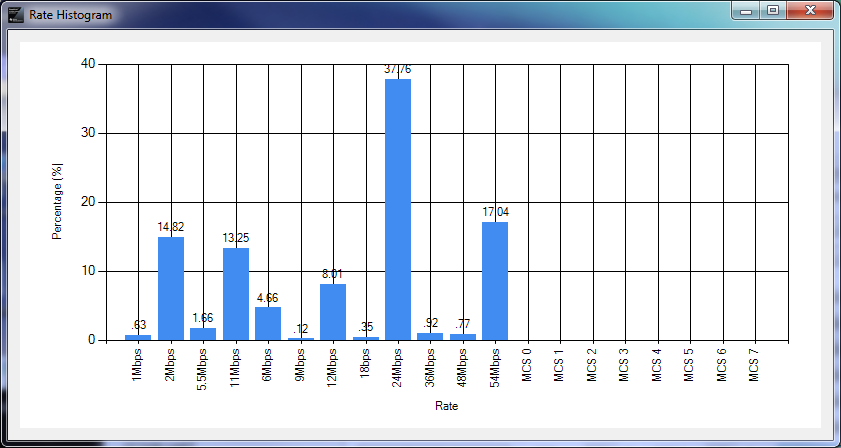 Figure 7-7 Rate Histogram Graph in
Percentage