SWRU467A February 2017 – June 2018 CC3120
-
CC3120 SimpleLink™ Wi-Fi® Internet-on-a chip™ Solution SDK Getting Started Guide
- Trademarks
- 1 Introduction
- 2 Prerequisites
- 3 Board Configuration
- 4 Programming the CC3120 BoosterPack™
- 5 Getting Started With the MSP-EXP432P401R LaunchPad™
- 6 Getting Started With SimpleLink™ Studio
- Revision History
5.5.4 Compiling and Debugging the Project in IAR
For the debug session, complete the following steps:
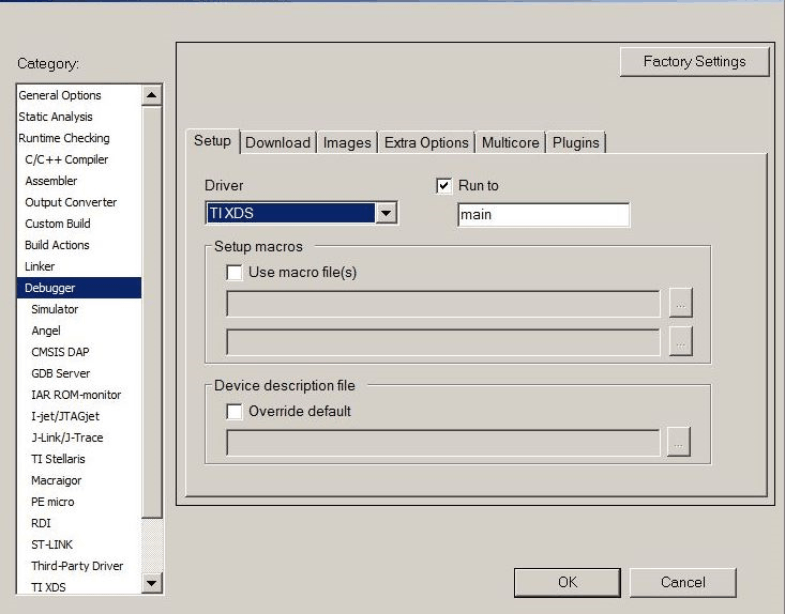
- Select Project → options from the menu, and select the Debugger category. In the Setup tab, choose TI XDS as the driver and click OK (see Figure 30).
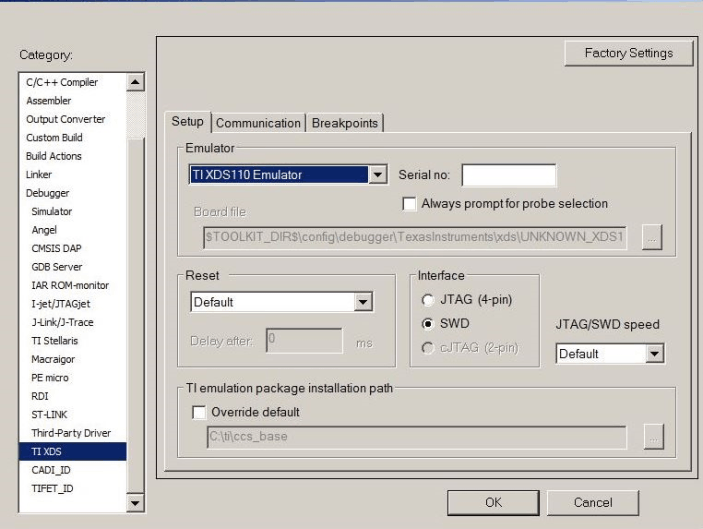
- Go to the TI XDS category, choose TI XDS110 Emulator as the emulator and JTAG (4-pin) as the interface (see Figure 31).
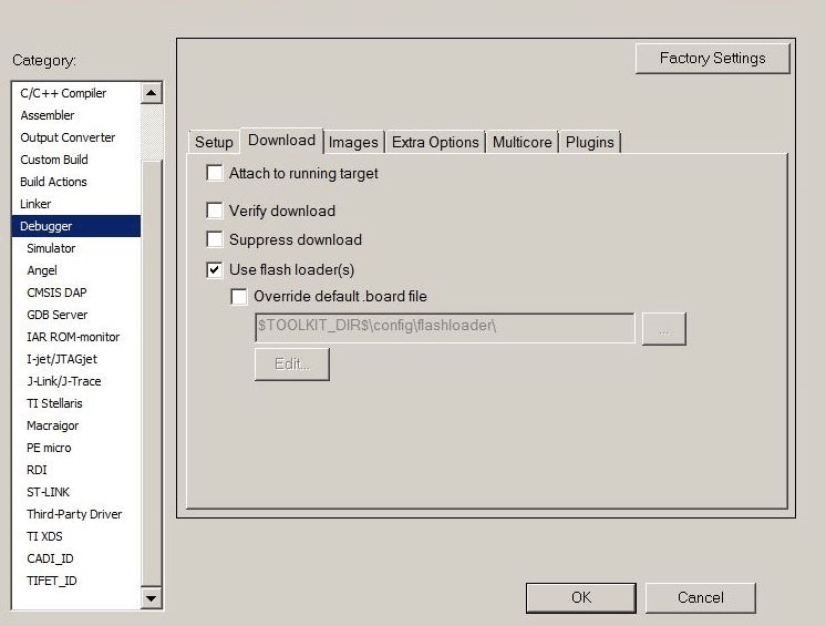
- Check the Use flash loader(s) checkbox in the Debugger → Download tab (see Figure 32).
- Start debugging by clicking the green arrow on the top of the window to start the debugger.
 Figure 30. IAR TI XDS Debugger
  Figure 31. IAR XDS110 Debugger
  Figure 32. IAR Debugger Settings