SNAU274 December 2021
3.4 Histogram Analysis
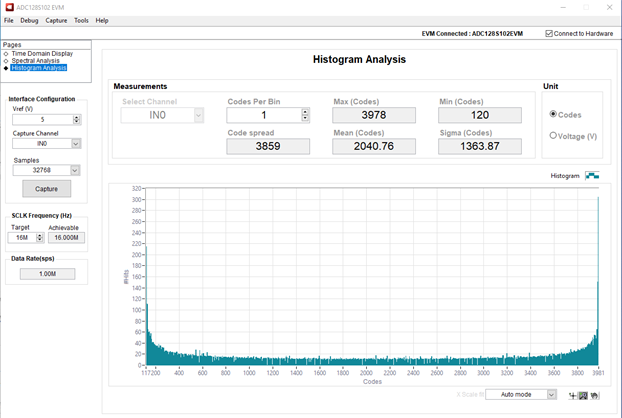
In the histogram analysis page, the data captured is displayed in a histogram (as shown in Figure 3-4) using digital code as the x-axis.
 Figure 3-4 Histogram of Sine Wave Input
SNAU274 December 2021
In the histogram analysis page, the data captured is displayed in a histogram (as shown in Figure 3-4) using digital code as the x-axis.
 Figure 3-4 Histogram of Sine Wave Input