SLVUBT1A October   2019  – June 2020 TPS50601A-SP


  1.   TPS50601A-SP Worst Case Analysis Unencrypted PSpice Average Model User's Guide
    1.     Trademarks
    2. 1 TPS50601A-SP WCA Model Specification
    3. 2 Default Parameters
    4. 3 Example of using model with Cadence Pspice (17.2.0)
      1. 3.1 Creating a part from the netlist file
      2. 3.2 Steps to create project in Capture
      3. 3.3 Creating the schematic in Capture
    5. 4 Simulating the Model
      1. 4.1 Monte Carlo Analysis of Output Voltage
      2. 4.2 Frequency Response Analysis
        1. 4.2.1 Analyzing Frequency Response with Bode Plot
        2. 4.2.2 Analyzing Frequency Response with Histogram
  2.   Revision History

Analyzing Frequency Response with Histogram

  1. Select Trace → Performance Analysis. A pop-up will appear. Click “OK”.
  2. Freq_PerfAnal.png
  3. Right click on the plot area and click "Add Trace".
  4. Copy the expression PhaseMargin(DB(v(vout)),P(v(vout))) into the Trace Expression field and click "OK". The histogram will be displayed in the trace window.

Freq_Hist.png
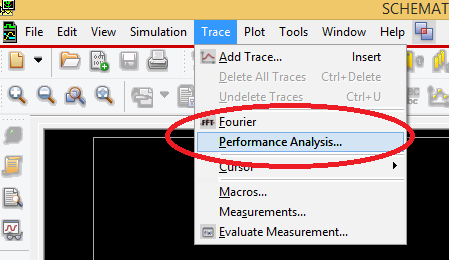
Figure 4. Frequency Response Histogram