SLVUBT1A October   2019  – June 2020 TPS50601A-SP


  1.   TPS50601A-SP Worst Case Analysis Unencrypted PSpice Average Model User's Guide
    1.     Trademarks
    2. 1 TPS50601A-SP WCA Model Specification
    3. 2 Default Parameters
    4. 3 Example of using model with Cadence Pspice (17.2.0)
      1. 3.1 Creating a part from the netlist file
      2. 3.2 Steps to create project in Capture
      3. 3.3 Creating the schematic in Capture
    5. 4 Simulating the Model
      1. 4.1 Monte Carlo Analysis of Output Voltage
      2. 4.2 Frequency Response Analysis
        1. 4.2.1 Analyzing Frequency Response with Bode Plot
        2. 4.2.2 Analyzing Frequency Response with Histogram
  2.   Revision History

Analyzing Frequency Response with Bode Plot

  1. To view the frequency response as Bode plot, click on Trace → Add Trace.
  2. FreqAn1.png
  3. This will bring in another pop-up with the netlist present in the schematic. Select the following options to get the Bode plot.
  4. FreqAn2.png
  5. Use the cursor to evaluate the plot.
  6. Freq_Response.png
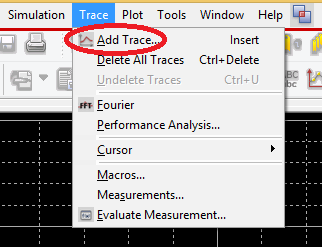
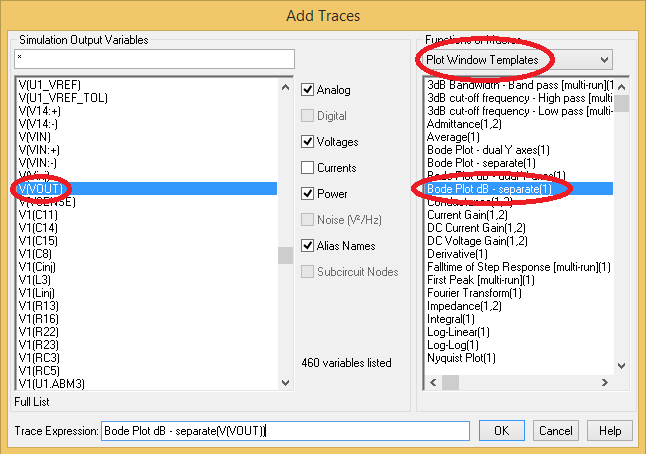
Figure 3. Frequency Response Bode Plot