TIDT249 September 2021
3.3 Bode Plots
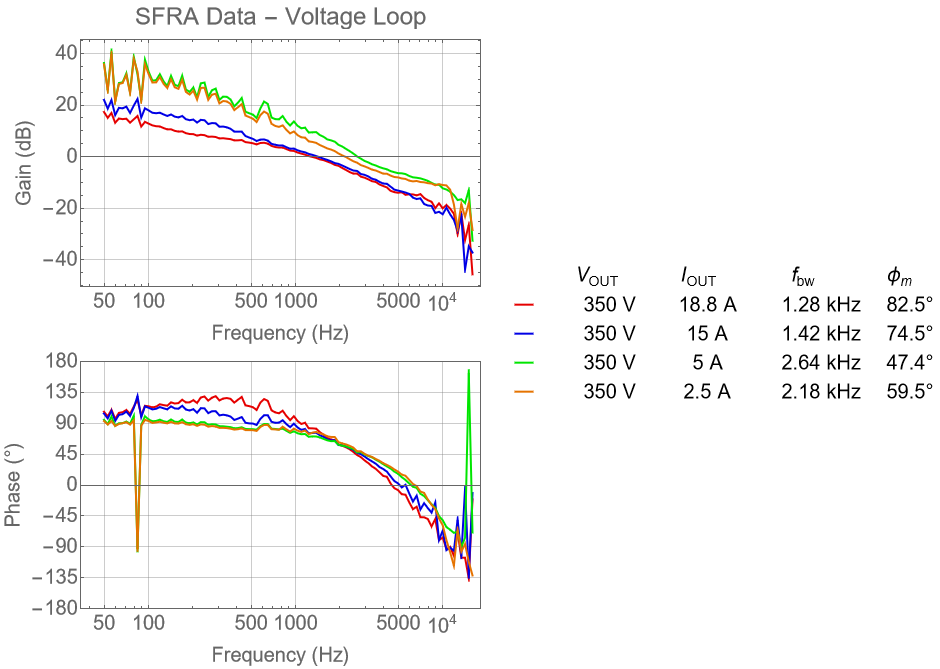
The following bode plots were acquired using the onboard software frequency response analyzer inside the TMS320F28388D microcontroller. The load used in the tests was configured as a constant current sink. The microcontroller is configured to regulate a constant output voltage. The bandwidth is roughly from 1 kHz to 2.5 kHz with a phase margin in excess of 45°.
 Figure 3-5 Voltage Loop Bode
Plot
Figure 3-5 Voltage Loop Bode
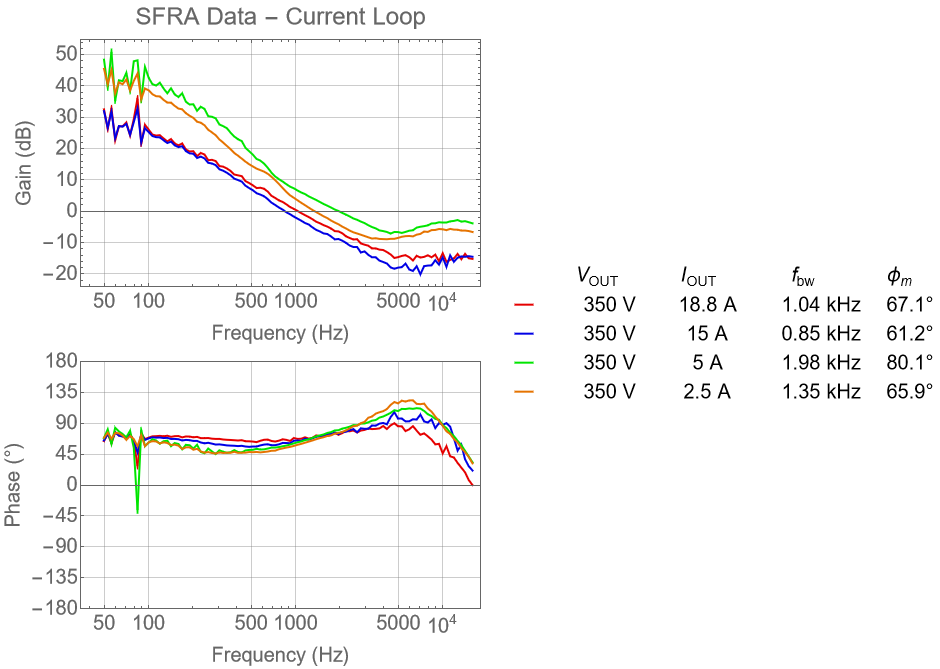
PlotThe following bode plots were acquired using the onboard software frequency response analyzer inside the TMS320F28388D microcontroller. The load used in the tests was configured as a constant voltage. The microcontroller is configured to regulate a constant output current. The bandwidth is roughly from 1 kHz to 2.5 kHz with a phase margin in excess of 60°.
 Figure 3-6 Voltage Loop Bode Plot
(Constant Voltage Load)