SLVAEB1A March 2020 – October 2021 TLV62568 , TLV62569 , TLV62585
- Trademarks
- 1Introduction
- 2Describing the TLV62569 Package Technologies: SOT23-5, SOT23-6, and SOT563
- 3Understanding Thermal Performance and Junction Temperature Estimation
- 4Measurement Setup and Test Results
- 5Thermal Performance Analysis for SOT23-5, SOT23-6, and SOT563 Packages
- 6Summary
- 7References
- 8Revision History
4.2 Thermal Measurements
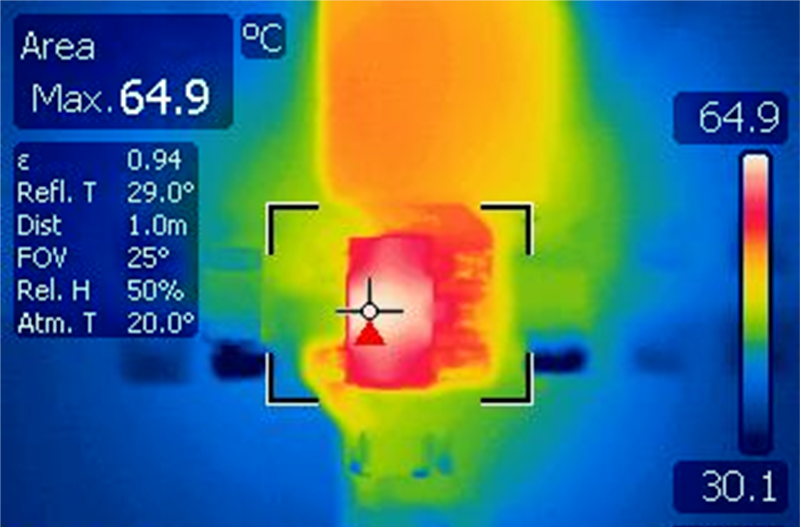
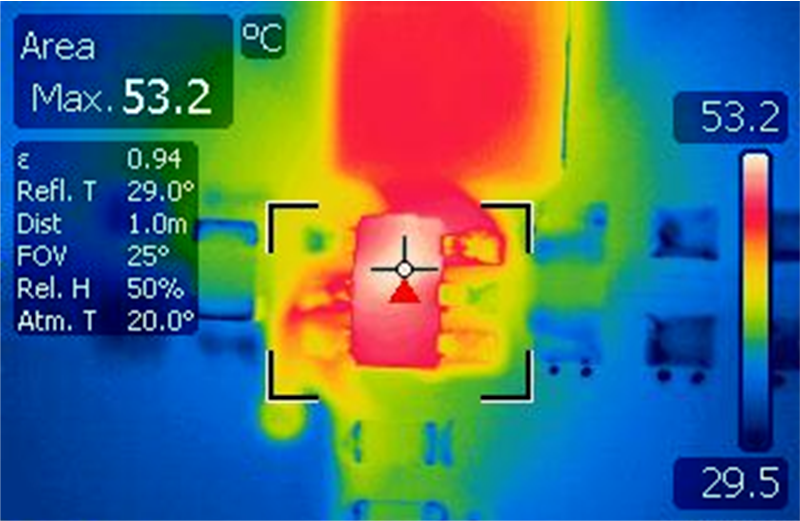
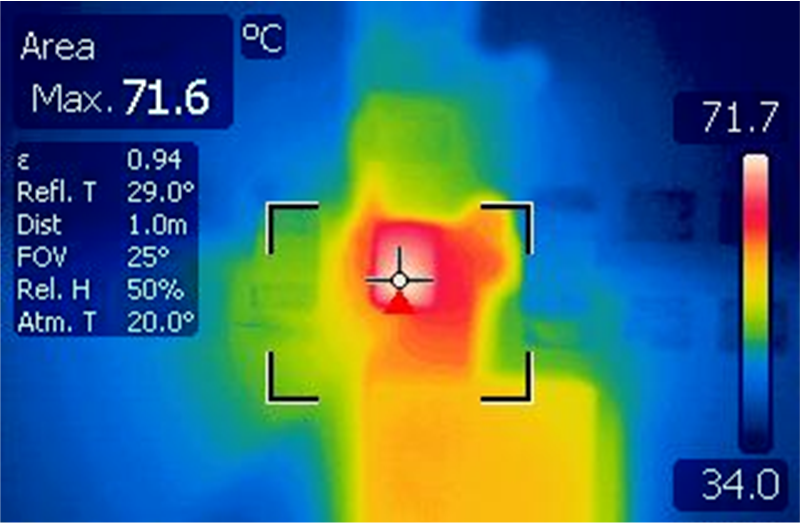
As a first step to evaluate the thermal performances on all three EVM boards, the case temperature of the IC is measured using a thermal camera for Vin = 5 V, Vout = 3.3 V over a load range of 250 mA to 2 A. Table 4-3 show an example of thermal pictures captured for Iout = 2A.
| SOT23-5 PACKAGE | SOT23-6 PACKAGE | SOT563 PACKAGE (DRL) |
|
|
|
| Case temperature: Tcase = 65°C | Case temperature: Tcase = 53°C | Case temperature Tcase = 72°C |
The results of IC case temperature measurements over the entire load range up to 2 A are compiled in Figure 4-4. As a next step, the junction temperatures of the IC in the three different packages are deducted using Equation 1. Figure 4-5 shows the results.
The thermal measurements are represented versus output current and IC power dissipation to demonstrate the linear relation between IC temperature and IC power dissipation on each of the EVMs.
 Figure 4-4 Case Temperature vs.
Dissipated Power
Figure 4-4 Case Temperature vs.
Dissipated Power Figure 4-5 Case Temperature vs.
Output Current
Figure 4-5 Case Temperature vs.
Output Current Figure 4-6 Calculated Junction
Temperature vs. Dissipated Power
Figure 4-6 Calculated Junction
Temperature vs. Dissipated Power Figure 4-7 Calculated Junction
Temperature vs. Output current
Figure 4-7 Calculated Junction
Temperature vs. Output currentThermal performances are critical for higher load current as power dissipation becomes a challenge with conduction losses increasing.
| DEVICE | CASE TEMPERATURE | JUNCTION TEMPERATURE | TEMPERATURE RAISE |
|---|---|---|---|
| SOT23-5 (DBV) | 65°C | 80°C | ~15°C |
| SOT23-6 (DDC) | 53°C | 58°C | ~5°C |
| SOT563 (DRL) | 71.6°C | 72°C | ≤1°C |
From graphs on Figure 4-2, Figure 4-4, and Table 4-4, three main observations can be made:
- SOT23-5 has the highest junction temperature.
- SOT23-6 has the lowest Junction and case temperature.
- SOT563 has the lowest junction to top temperature raise.
Figure 4-8 shows thermal comparison of TPS563201 and TPS563202. Because of different theta JA, TPS563201 thermal performance is a little better than TPS563202.
This section concentrated on the method to measure and estimate IC temperature and tangible results were shown for the TLV62569. Moving forward, the focus is set on the analysis of these measurement results and the meaning in terms of IC packaging.