SLAAE30 July 2021 MSP430FR2355
2.3 Power Profile
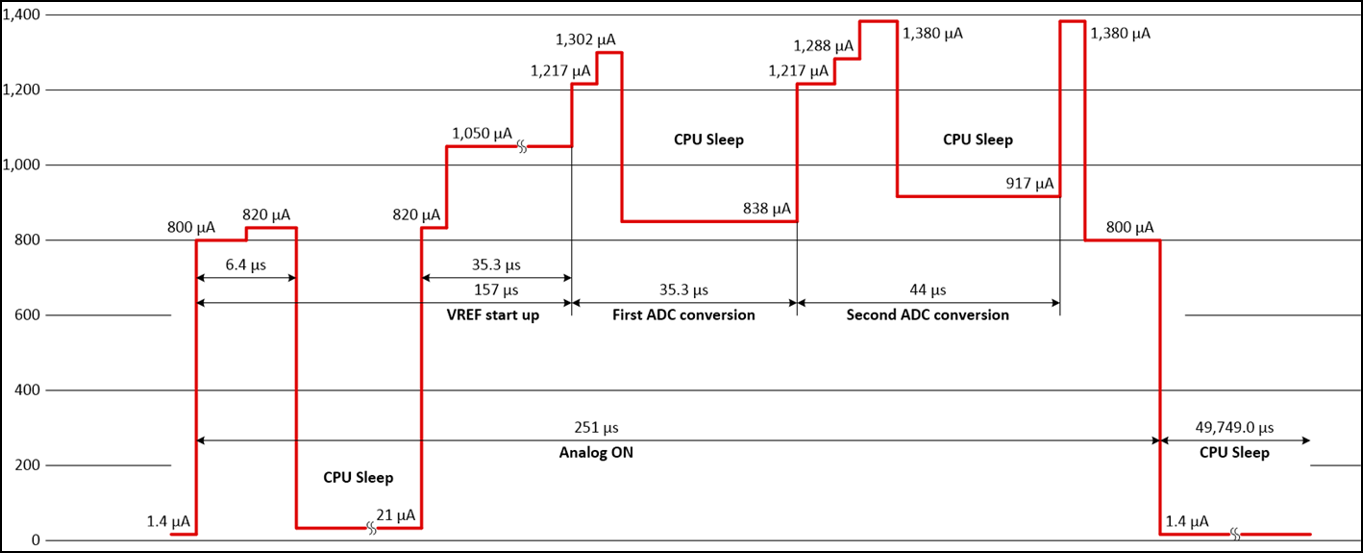
The software flow is also what controls the system's power profile. The first current spike is where the MSP430 wakes to enable the analog circuits, then goes back to sleep while the reference voltages are stabilizing. After a short period of time, the MSP430 wakes back up to check the Vref reference voltage and that the SACs are ready. Two ADC measurements are made from each stage of the signal chain. Finally, there is some data processing on the new samples to determine if there was motion before the MSP430 shuts down the analog circuitry and returns back to sleep where the system it spends 99% of it's time.
This software flow gives us an average current of approximately 6 µA with a 20 sps measurement rate.
 Figure 2-3 Power Profile of MSP430 PIR
Demo Software