SLAA351A April 2007 – November 2018 MSP430F2232 , MSP430F2232 , MSP430F2234 , MSP430F2234 , MSP430F2252 , MSP430F2252 , MSP430F2254 , MSP430F2254 , MSP430F2272 , MSP430F2272 , MSP430F2274 , MSP430F2274
3.4.1.1 Signal Averaging, Peak Detection, and Zero Crossings
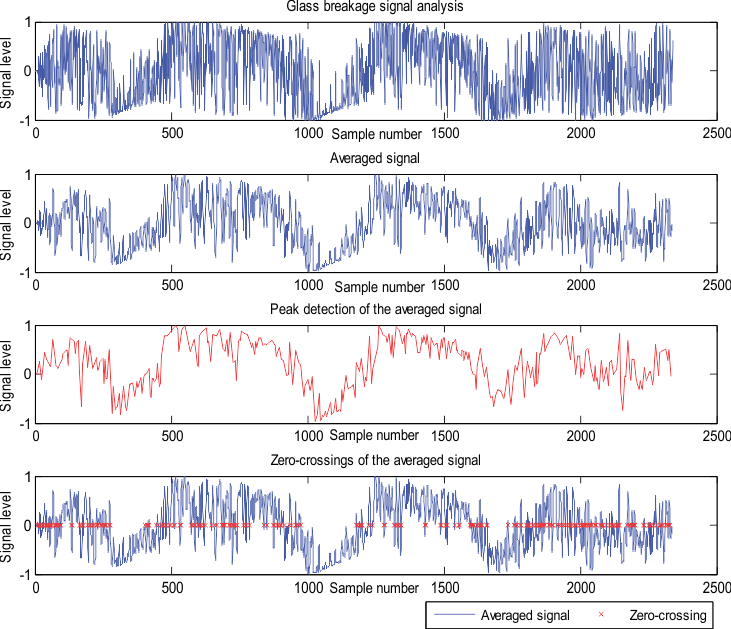
To reduce noise in the incoming signal, a signal averaging is done. The averaged signal is obtained using a simple accumulate function of the current input sample and the previous three samples. This process is needed only to obtain accurate results during peak detection and zero crossings. An integration of the positive nonaveraged signal is done to facilitate the second stage of processing. During this integration, a check for overflow is done and kept count to accommodate a 32-bit result. The number of zero crossings of the averaged signal is done as part of the algorithm used to detect a glass breakage. Figure 9 shows the signal averaging, peak detection, and the zero crossings of the averaged signal, respectively.
 Figure 9. Glass-Breakage Signal Analysis in Time Domain