SLVUBJ9A July   2020  – October 2020 TPS54JB20


  1.   1
  2.   2
    1.     3
    2.     4
    3.     5
      1.      6
      2.      7
      3.      8
      4.      9
      5.      10
  3.   11
    1.     12
    2.     13
    3.     14
    4.     15
    5.     16
    6.     17
    7.     18
    8.     19
    9.     20
  4.   21
    1.     22
    2.     23
    3.     24
  5.   25

Loop Characteristics

Figure 2-6 shows the TPS54JB20EVM loop-response characteristics. Gain and phase plots are shown for VIN voltage of 12 V. Load current for the measurement is 100%.
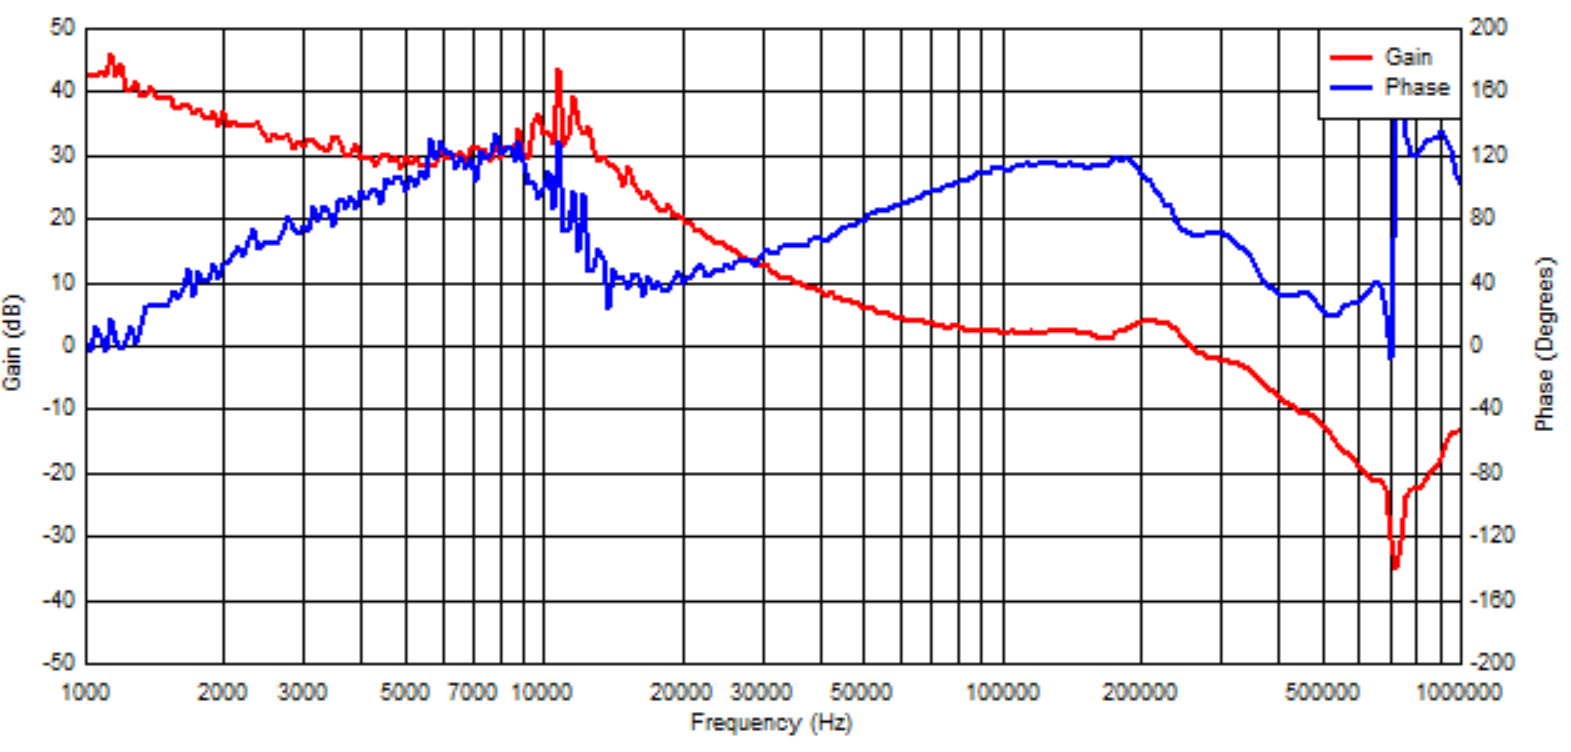
GUID-08B83CD0-8C7C-41BF-9371-138F5A7B2603-low.png Figure 2-6 TPS54JB20 Bode Plot