SLAA220A November 2004 – August 2018 MSP430F423 , MSP430F423 , MSP430F423A , MSP430F423A , MSP430F425 , MSP430F425 , MSP430F425A , MSP430F425A , MSP430F427 , MSP430F427 , MSP430F427A , MSP430F427A
3 Software Description
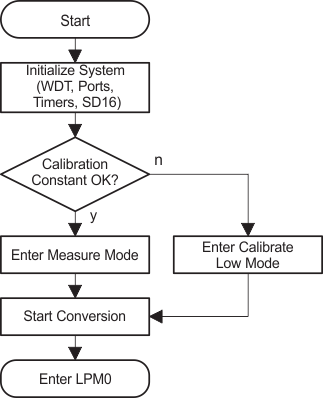
The MSP430F427A single-chip weight scale software is provided in both C (F42x_Weigh_ Scale.c) and assembly (F42x_Weigh_Scale.s43). The source codes are functionally identical, however, the assembly language version is smaller in terms of code size. On power-on reset, the MSP430 peripherals are initialized. To initialize the peripherals, the software disables the watchdog timer, configures the LFXT1 oscillator load capacitors for the external watch crystal, initializes the LCD controller, the basic timer, and the SD16 sigma-delta ADC module. The software configures SD16 channel 0 to use the input channel pair A0 and amplify the signal with a gain of 32 with the internal PGA. SMCLK provides a 1048567-Hz frequency to the converter, which uses the continuous conversion mode. For more information on SD16 operation, refer to the MSP430x4xx Family User's Guide.
 Figure 1. Flowchart Main()
 In the source code, the two 32-bit words CalMin and CalMax are allocated in the MSP430 flash information memory segment A to hold calibration data. After power on, the software checks if these constants have valid values. If both locations contain the same value (such as 0xFFFFFFFF after device programming), the application enters calibration mode. Otherwise, the application enters measurement mode. The variable ProgramMode keeps track of the current program state (measure mode, calibration mode, power-down mode).
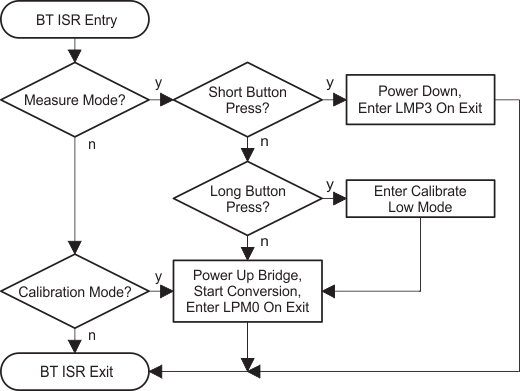
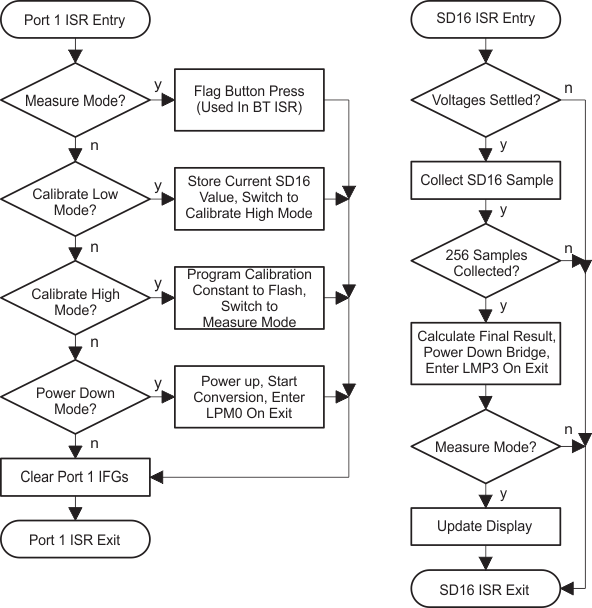
Next, the MCU enters low-power mode 0 (LPM0) with interrupts enabled. LPM0 is used as SMCLK is driving the SD16 and cannot be disabled while the application is actively running and collecting ADC data. The rest of the program flow is interrupt driven. Three interrupt sources are enabled. The basic timer ISR is executed every 0.5 s and is mainly used to trigger the start of the measurement process (see Figure 2). The Port 1 ISR handles button events and the completion of each analog-to-digital conversion. The SD16 ISR processes the results (see Figure 3).
 Figure 2. Flowchart Basic Timer ISR
 While in calibration mode, two data points are obtained. The variable CalMin stores the ADC result that equals a display value of 0 g. The variable CalMax stores the ADC result that equals a display value of 10000 g. CAL LO or CAL HI is displayed to indicate which calibration data point is being processed. When the user presses the button, the current SD16 ADC result is read and stored in a temporary variable. After the calibration procedure, these two data points are programmed into the INFO A flash information memory segment using in-system self programming. The software now enters measurement mode.
The SD16 conversion process is started every 0.5 s by the basic timer ISR. During conversions, the bridge sensor is powered up and the DCO is enabled. The MSP430 MCU operates in LPM0. To achieve the needed precision, the software implements a low-pass filter by collecting and summing multiple 18-bit ADC results. After each conversion, the SD16 ISR is executed at the SD16 sample rate (4 kHz). Before actual sample data is collected, the counter variable VoltageSettleCtr is decremented to 0 to allow approximately 12 ms for the voltages to settle after powering up the bridge sensor. When the SD16 ISR has collected 256 results, the sum is then divided by 256 to generate the final 18-bit result. This process can also be described as a 256-to-1 decimation of the sampling data. Including the voltage settling time, the SD16 module operates for approximately 75 ms each 0.5 s.
The calculated value is then compared to the prior value. To avoid unnecessary 32-bit integer multiplications and divisions, a new display value is calculated and the display is updated only if the value has changed.
 Figure 3. Flowcharts Port 1 and SD16 ISRs
 For converting ADC measurement results into actual physical weight values, a two-point calibration mechanism is used. The display value is calculated according to the Equation 4.

The range from CalMax to CalMin is projected into a range from 0 to CAL_MIN_MAX_SPAN. CAL_MIN_MAX_SPAN is set by default to 10000, which equals the maximum bridge sensor mechanical load of 10 kg. Due to the differential signal applied to the SD16 module, the 18-bit ADC result is signed, and that signed arithmetic is used throughout the program. This way negative weight values can be displayed. After the measurement process, the SD16 module is disabled, the DCO switches off through entering LPM3 on exit, and the bridge sensor is powered down to reduce current consumption.
Pushing the button disables the conversions immediately, switches off the LCD display, and enters LPM3. In this mode, the application circuit draws less than 1-µA current, with the 32-kHz oscillator still running. LPM4 could be used instead to reduce current consumption even further if required. When the user pushes the button again, the application resumes normal active operation. In this mode, the SD16 module is operated for approximately 75 ms every 0.5 s, the new result is calculated, and the display is updated. During this time, the MCU draws approximately 1 mA of current. Another 3 mA is needed in this period for bridge sensor excitation and reference voltage generation. Between the measurements, the MCU draws approximately 3 µA, which includes the current used by the LCD driver for displaying the calculation result. This results in a total average application current consumption of 600 µA during normal operation.
Calibration mode can be entered any time by holding down the button for at least 5 seconds.