TIDT367 December 2023
- 1
- Description
- Features
- Applications
-
1Test Prerequisites
- 1.1 Voltage and Current Requirements
- 1.2 Required Equipment
- 1.3 Test Setup
- 1.4
Running the Code for Different Labs
- 1.4.1 Lab 1. Primary to Secondary Power Flow, Open Loop Check PWM Driver
- 1.4.2 Lab 2. Primary to Secondary Power Flow, Open Loop CheckPWM Driver and ADC With Protection
- 1.4.3 Lab 3. Primary to Secondary Power Flow, Closed Voltage Loop Check
- 1.4.4 Lab 4. Primary to Secondary Power Flow, Closed Current Loop Check
- 1.4.5 Lab 6. Secondary to Primary Power Flow, Open Loop Check PWM Driver
- 1.4.6 Lab 7. Secondary to Primary Power Flow, Open Loop Check PWM Driver and ADC With Protection
- 1.4.7 Lab 8. Secondary to Primary Power Flow, Closed Voltage Loop Check
- 2Testing and Results
- 3Waveforms
1.3.2 Software Setup
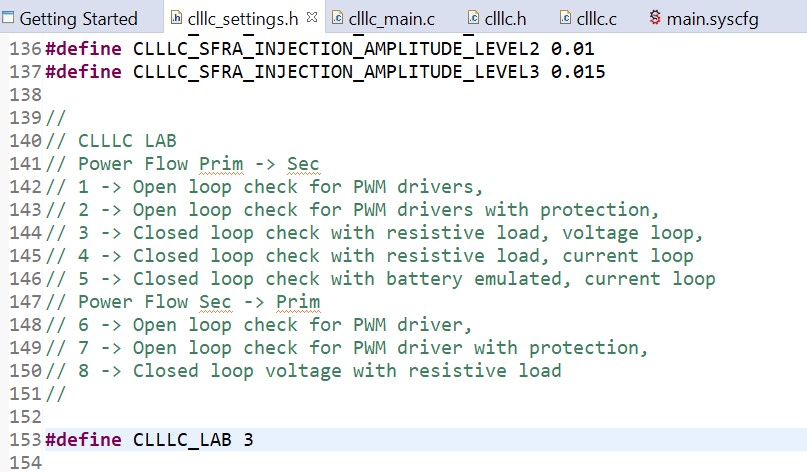
 Figure 1-2 Test Lab Selection
File
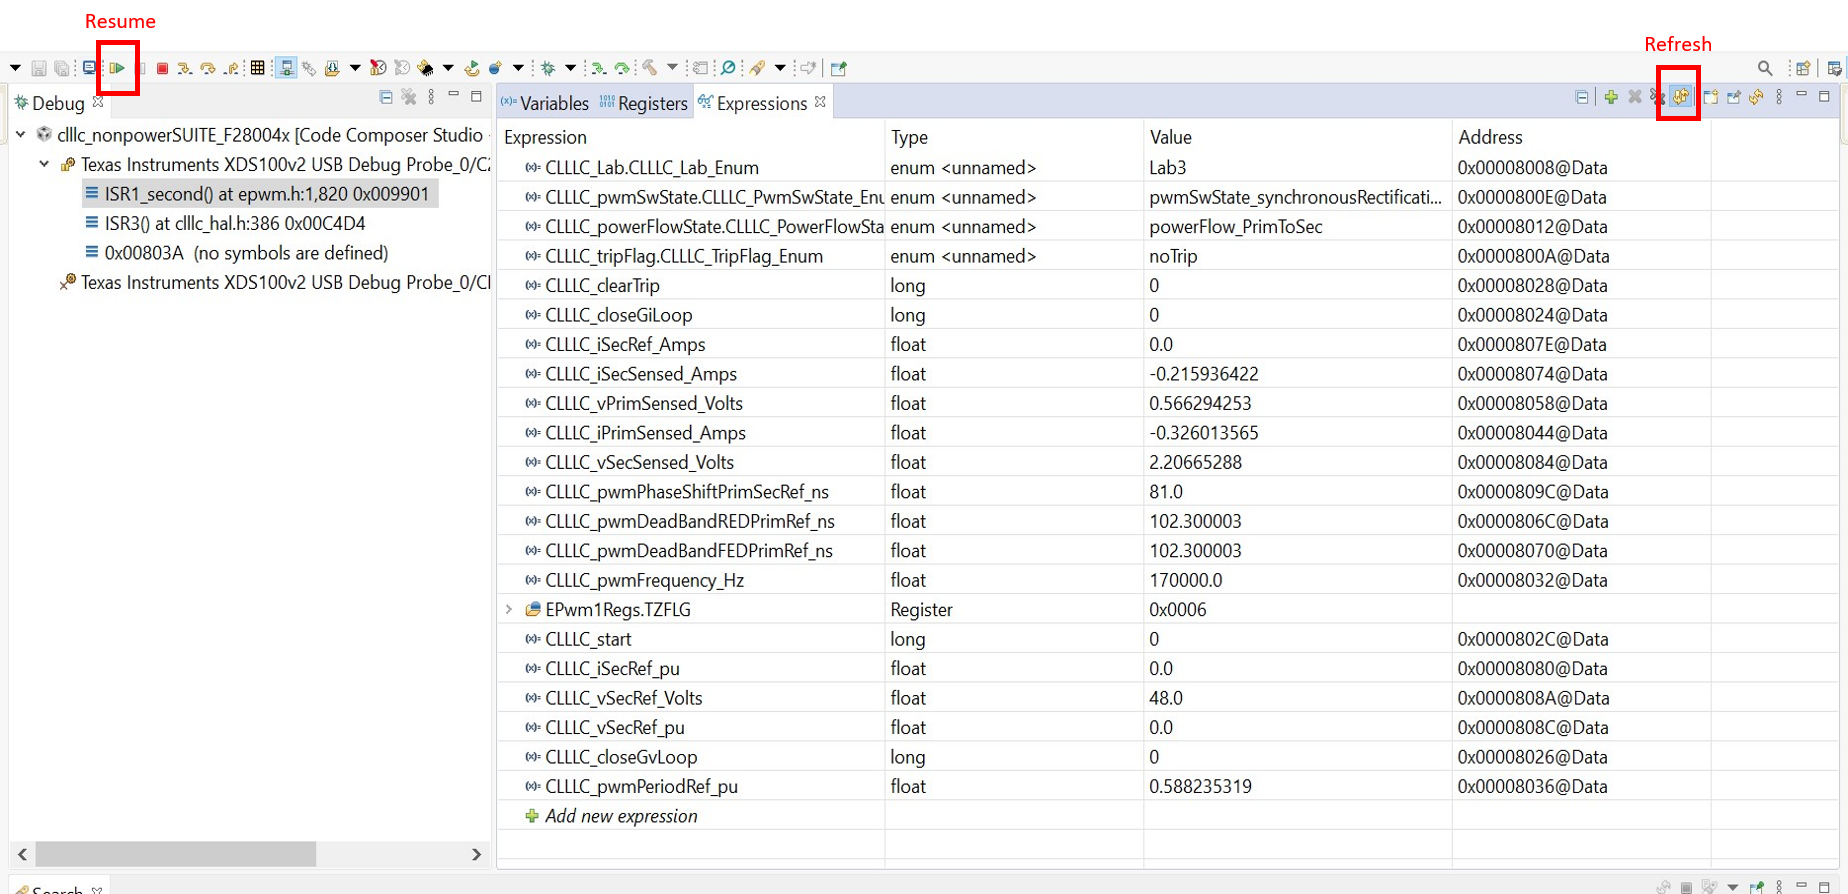
 Figure 1-3 Expression Watch
Window
Figure 1-3 Expression Watch
Window- Install Code Composer Studio from the Code Composer Studio (CCS) Integrated Development Environment (IDE) tools folder. Version 11.2 or above is recommended.
- Go to View → Resource Explorer. Below the TI Resource Explorer, go to C2000Ware DigitalPower SDK. To open the reference design software as is (opens firmware as run on this design and hardware, requires the board to be exactly the same as this reference design).
- Under C2000Ware DigitalPower SDK, select Development Kits → PMP41042, and click on Run Project. This action imports the project into the workspace environment.
- To get started, click clllc_nonpowerSUITE_F28004x item in Project Explorer.
- In the settings.h file, change the LAB number to select different LAB to run different function as shown in Figure 1-2.
- Right click on the project name and click Rebuild Project. Then, click Run → Debug to launch a debugging session.
- The project then loads on the device and the CCS debug view becomes active. The code halts at the start of the main routine.
- To add the variables in the watch/expressions window, click View → Scripting Console to open the scripting console dialog box. On the upper right corner of this console, click on Open and then browse to the setupdebugenv_labx.js script file located inside the project folder. This populates the watch window with the appropriate variables needed to debug the system.
- Click on the Continuous Refresh button on the watch window to enable continuous update of values from the controller. The watch window appears as shown in Figure 1-3.