TIDT324 February 2023
2.1 Efficiency Graphs
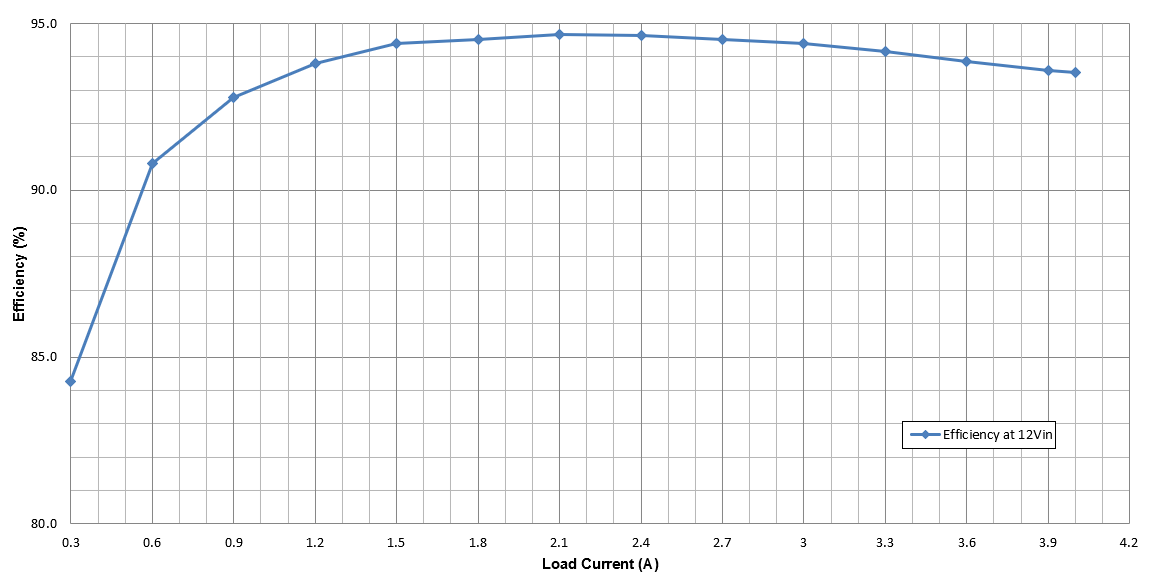
#FIG_Z3J_FHK_2MB shows the converter efficiency for a 12-V input and –8-V output with the load current being swept from 0.3 A to 4 A.
 Figure 2-1 Efficiency Graph
TIDT324 February 2023
#FIG_Z3J_FHK_2MB shows the converter efficiency for a 12-V input and –8-V output with the load current being swept from 0.3 A to 4 A.
 Figure 2-1 Efficiency Graph