TIDT283 May 2022
2.2 UCC14240 Output Ripple
Output ripple waveforms are shown in the following figures.
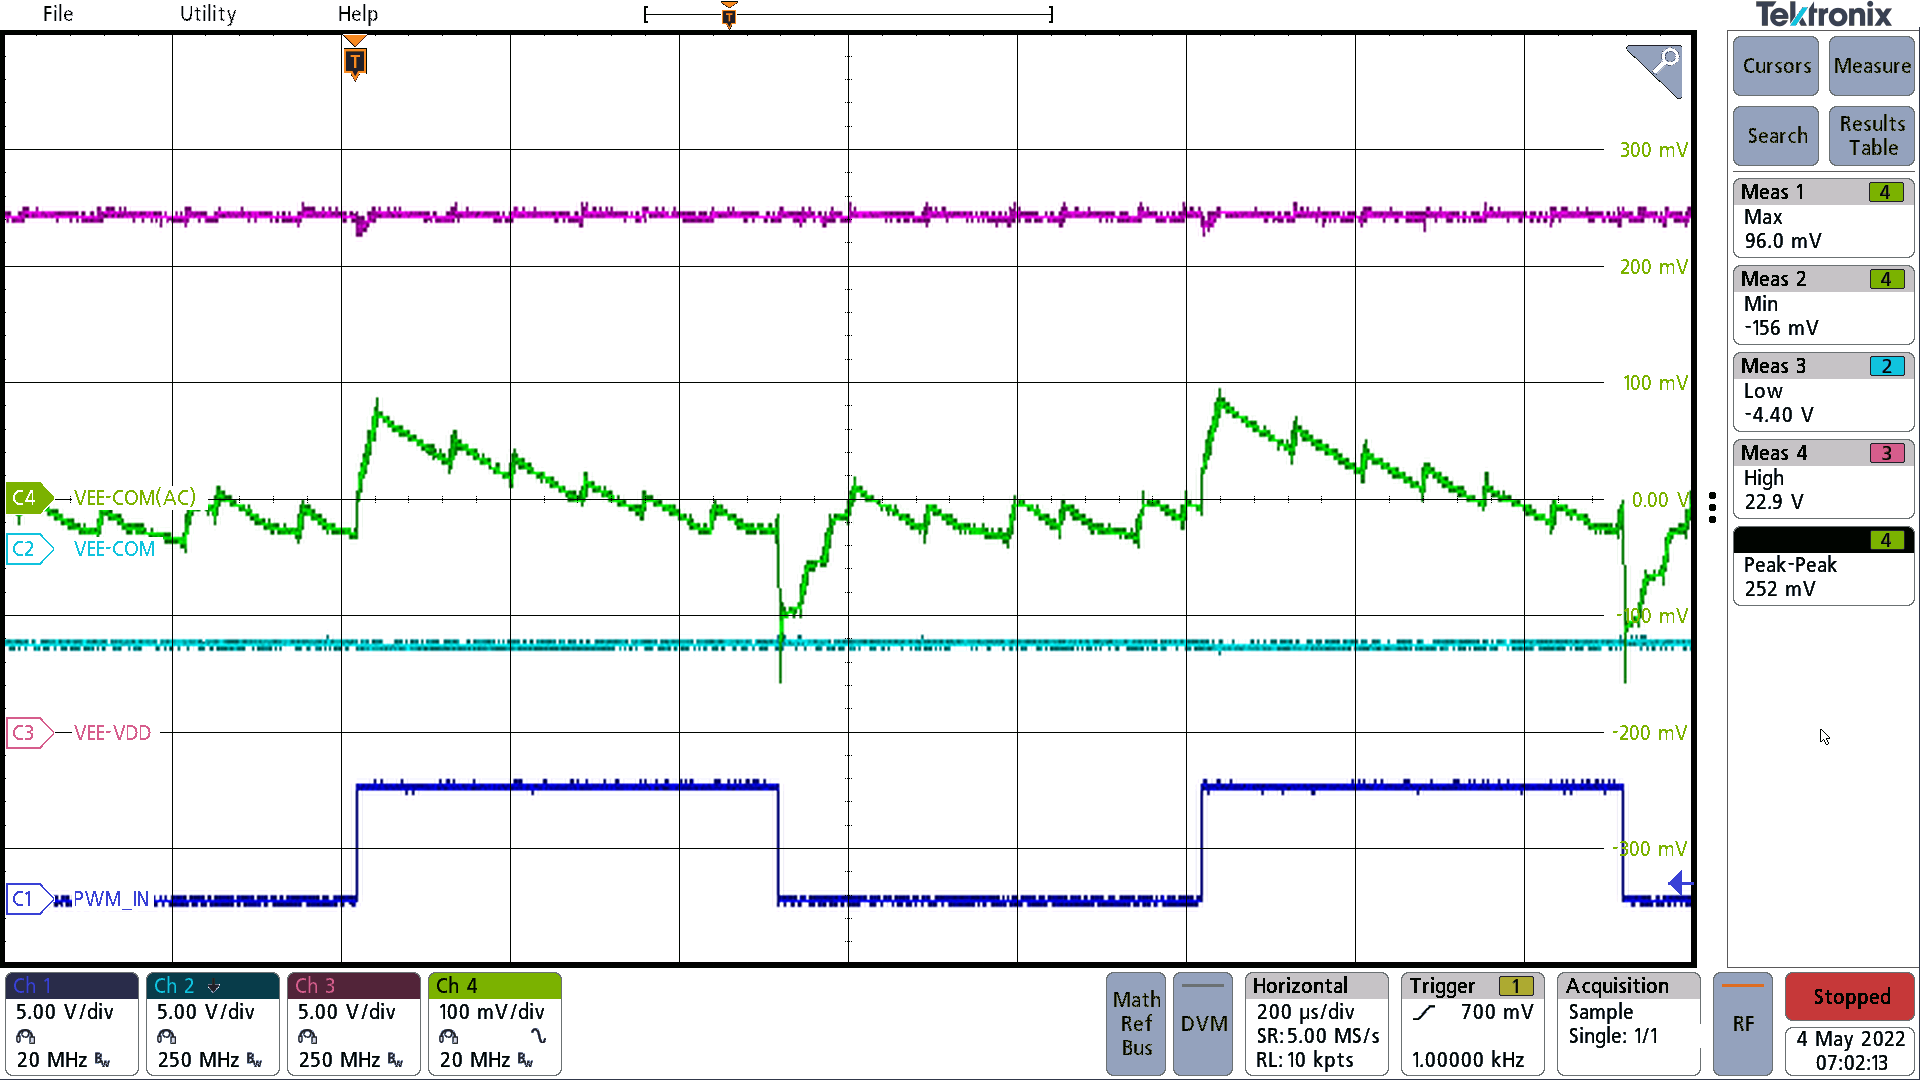
The green waveform in Figure 2-2 shows the VEE-COM rail ripple while the output is switching a 100-nF capacitive load at 1 kHz. The peak-to-peak ripple is 252 mV, which is 6.3%.
 Figure 2-2 VEE-COM Switching 100-nF Load
at 1 kHz
Figure 2-2 VEE-COM Switching 100-nF Load
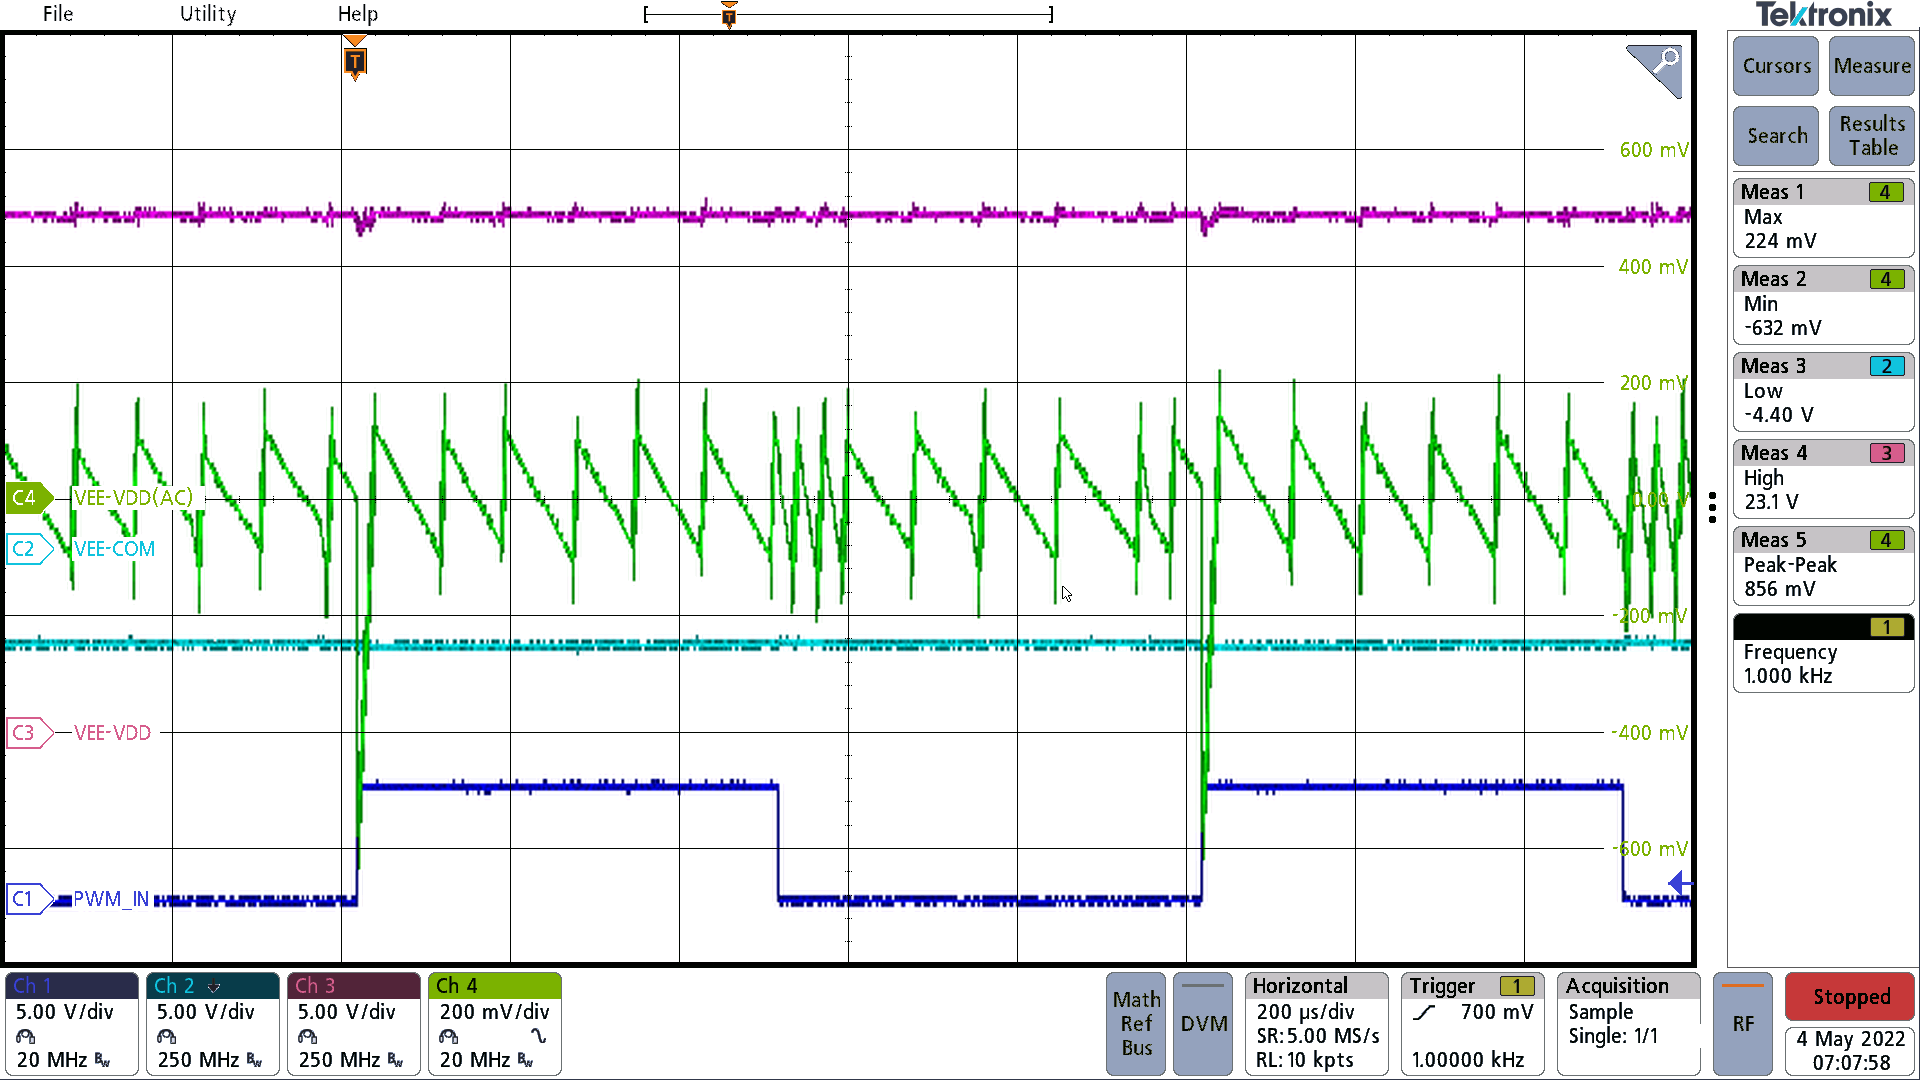
at 1 kHzThe green waveform in Figure 2-3 shows the VEE-VDD rail ripple while the output is switching a 100-nF capacitive load at 1 kHz. The peak to peak ripple is 865 mV, which is 3.9%.
 Figure 2-3 VEE-VDD Switching 100-nF Load
at 1 kHz
Figure 2-3 VEE-VDD Switching 100-nF Load
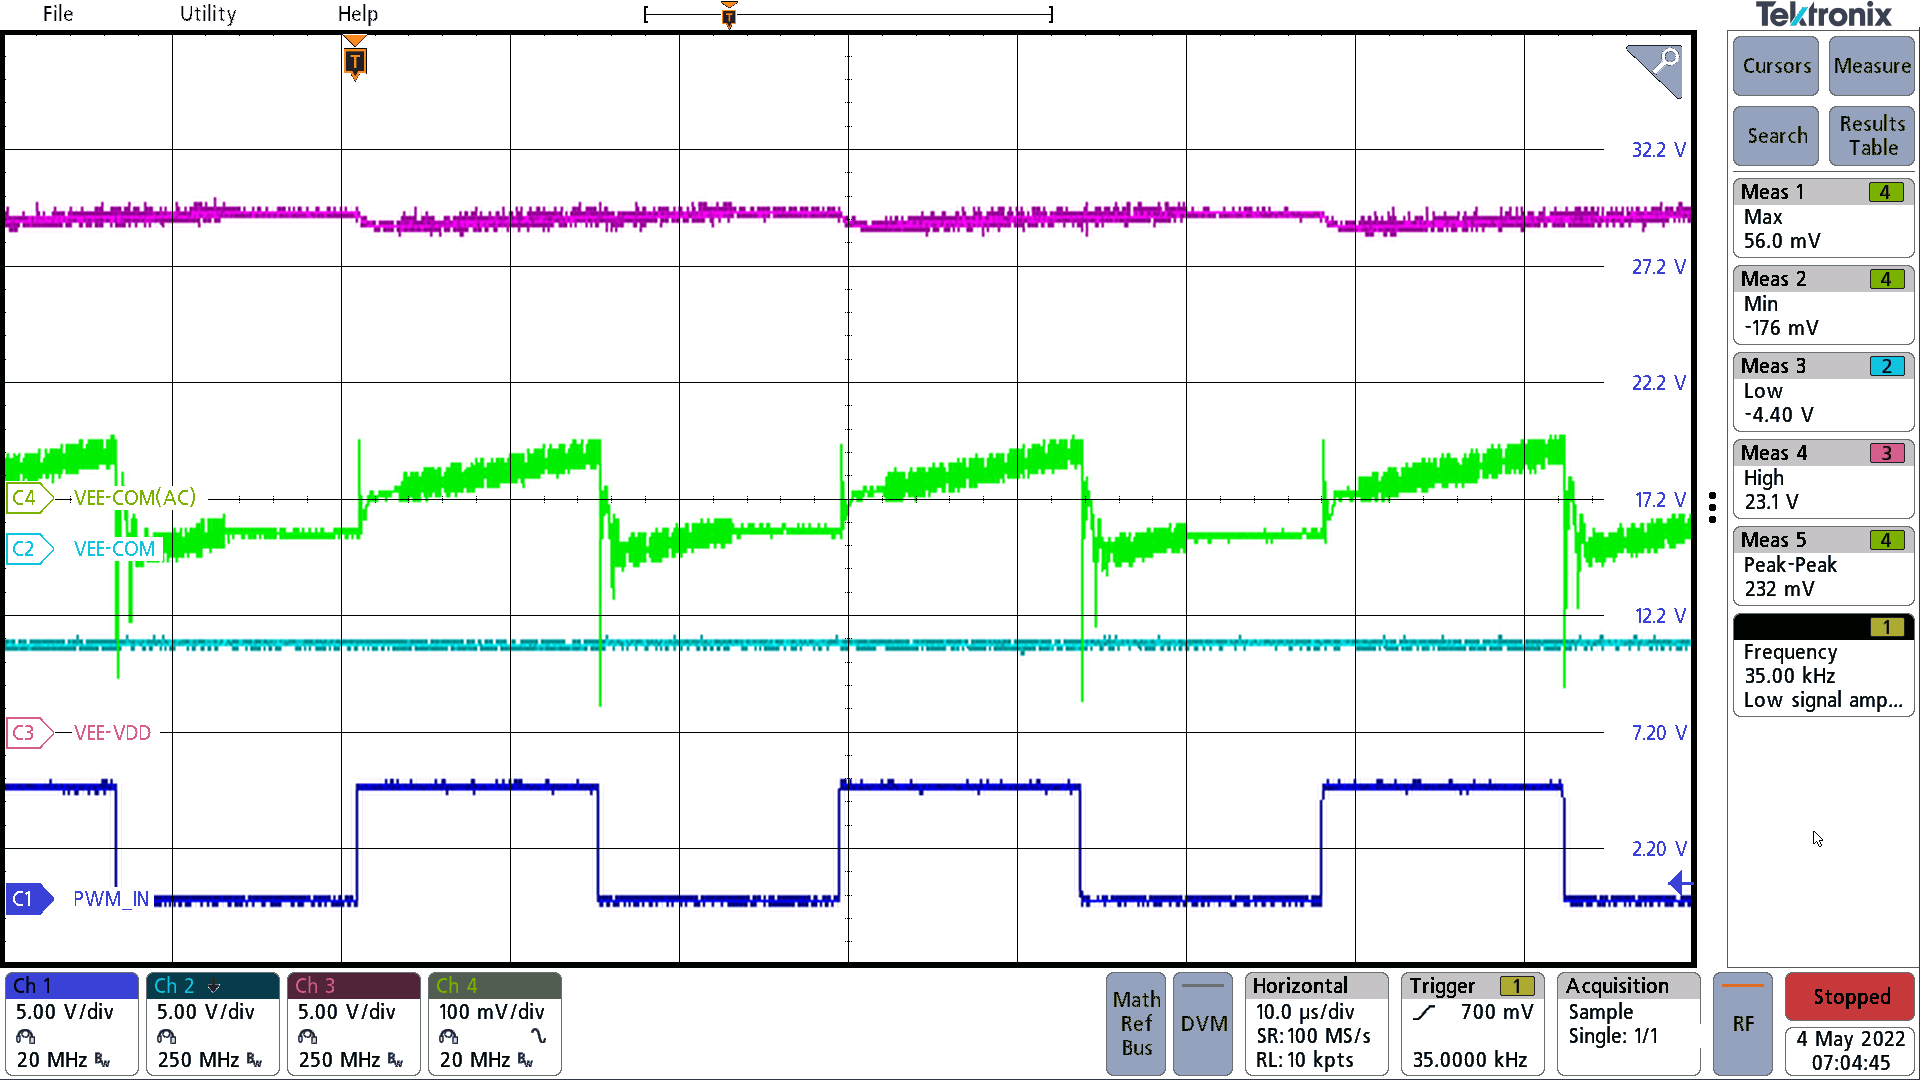
at 1 kHzThe green waveform in Figure 2-4 shows the VEE-COM rail ripple while the output is switching a 100-nF capacitive load at 35 kHz. The peak to peak ripple is 232 mV, which is 5.8%.
 Figure 2-4 VEE-COM Switching 100-nF Load
at 35 kHz
Figure 2-4 VEE-COM Switching 100-nF Load
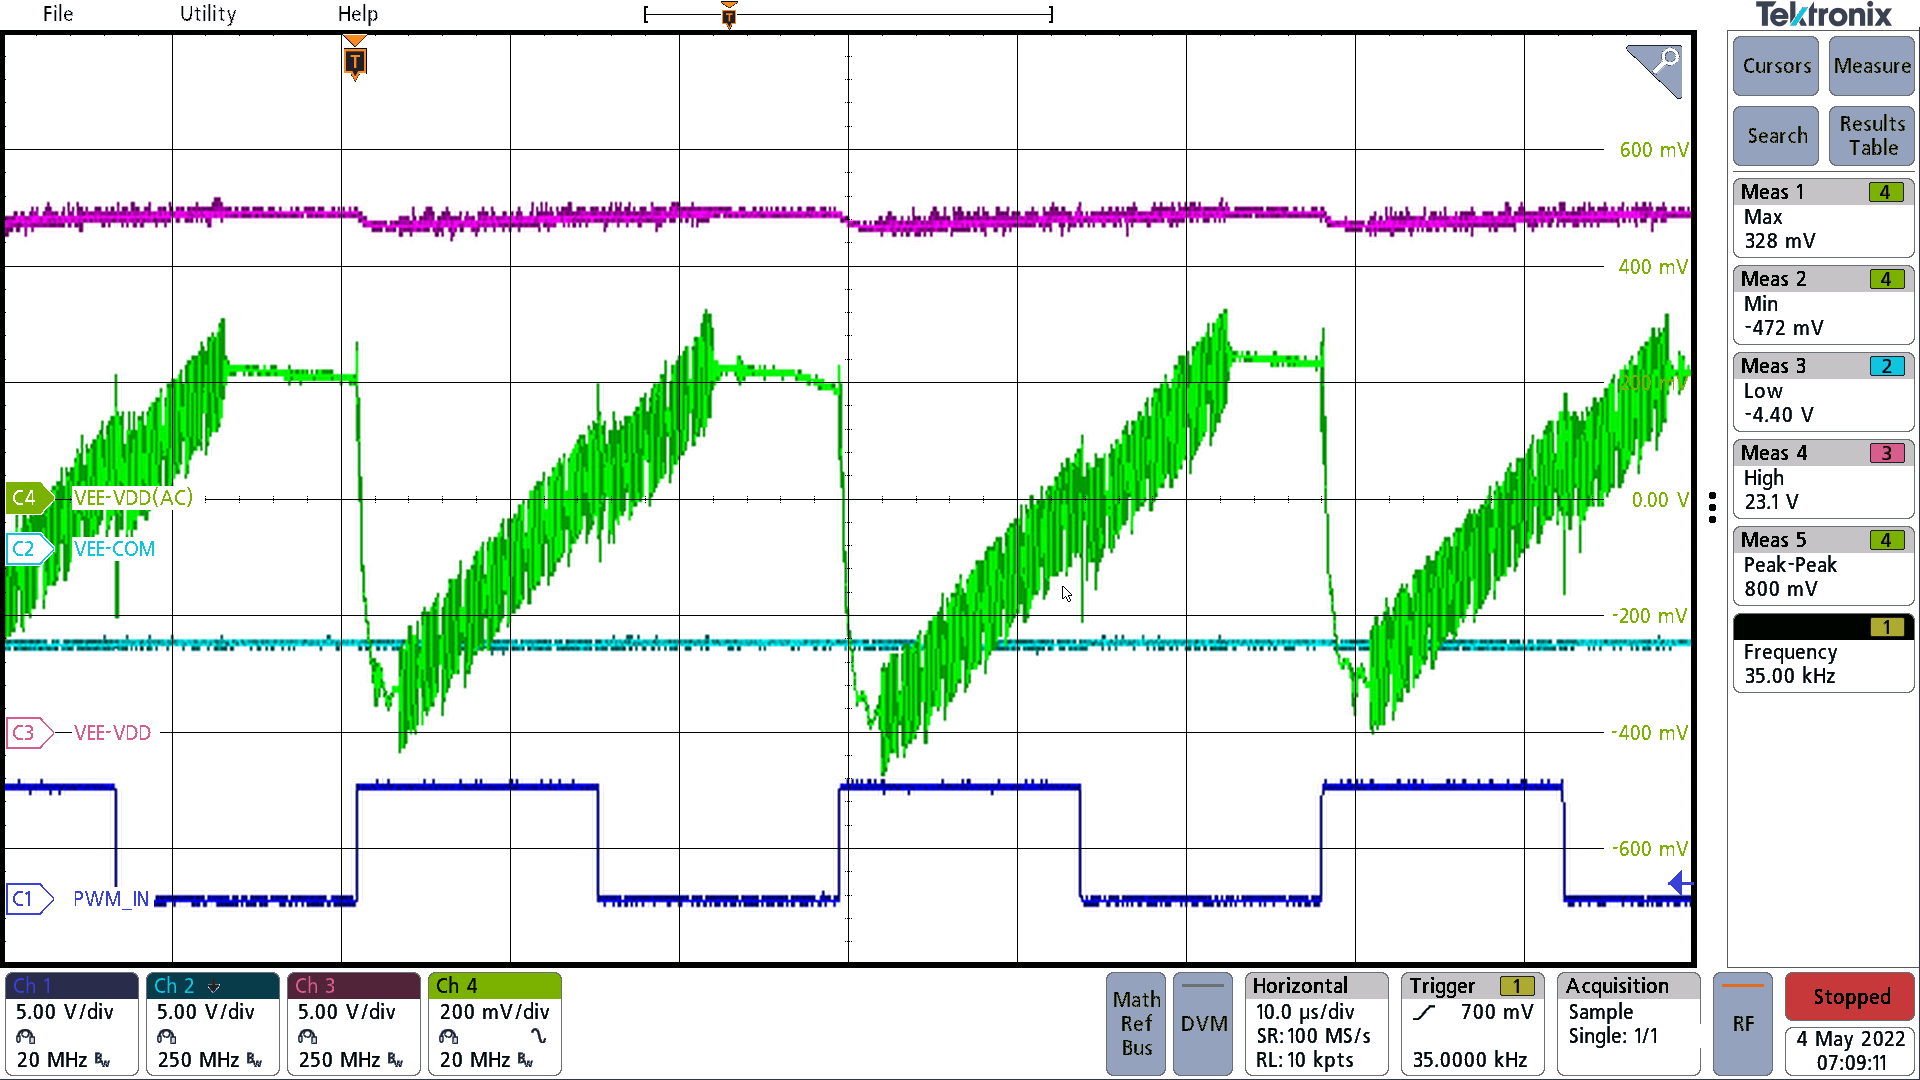
at 35 kHzThe green waveform in Figure 2-5 shows the VEE-VDD rail ripple while the output is switching a 100-nF capacitive load at 35 kHz. The peak to peak ripple is 800 mV, which is 3.6%.
 Figure 2-5 VEE-VDD Switching 100-nF Load
at 35 kHz