SSZTCK5 june 2015 TPIC8101
Engine knock sensors are used to improve engine efficiency and performance by monitoring engine vibrations. The engine control unit (ECU) uses this data to adjust the fuel and air ratio to reduce “engine pinging” and correct the timing of the engine. TI’s TPIC8101 serves as a signal conditioner for such engine knock sensors. Newer solutions sometimes integrate this functionality into one of the MCU’s in an engine’s ECU, however, this means that the processing might be done more remotely (due to the lower temperature grades of microcontrollers) which can degrade the signals. The TPIC8101’s performance can be validated by looking at how well the signal from the knock sensor is extracted compared to the noise of the system.
Brief Theory of Operation:
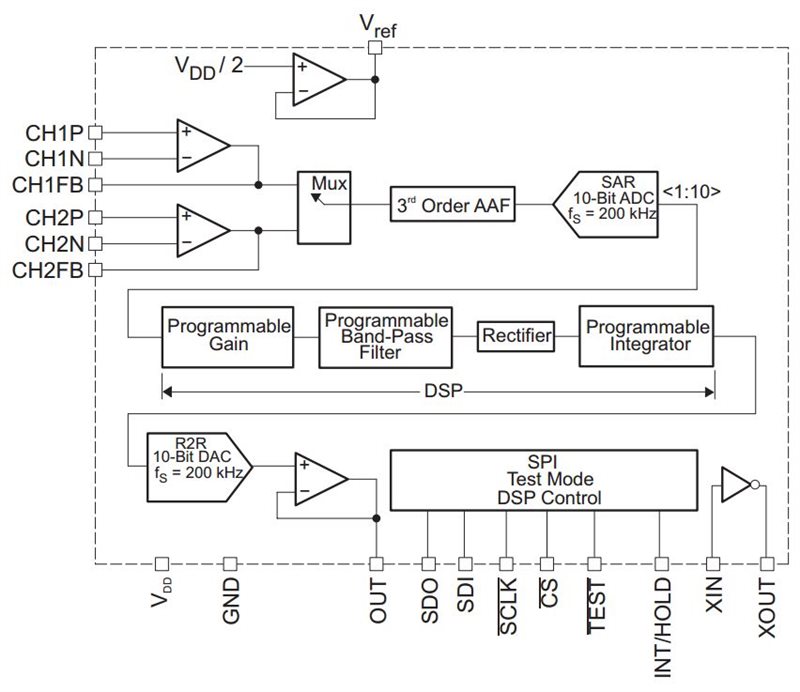
The TPIC8101 performs the signal conditioning of knock sense elements, which are resonant piezoelectric sensor elements. After passing through input amplifiers, noise is filtered out of the signal with a band-pass filter centered on the center frequency of the sense element. The signal is then rectified and integrated. This output can then be transmitted either digitally or through an analog signal. The ECU monitors the strength of this signal to determine when a knock occurs.
 Figure 1 TPIC8101 Internal Block Diagram
One of the purposes of the knock sensor signal conditioner is to reject all out of band noise since the engine is already an inherently noisy environment. For this reason, the signal-to-noise ratio (SNR) that the system provides is very important. Specifically, the band-pass filter dictates how well noise is rejected form the system. To measure the performance of the band-pass filter, the following steps must be performed.
- Choose the parameters such as bandpass filter center frequency, integration time constant, amplifier gain, and integration time window as explained in “Section 9.2.2” in the TPIC8101 datasheet. These should be set according to the system level requirements, or the values in the example test settings in Table 1 can be used.
- Use a function generator to generate a sine wave at the specified frequency and amplitude to mimic the output of a knock sense element.
- Record the Peak voltage of the signal.
- Adjust the frequency of the input signal and re-measure the signal.
The plot of the output voltage ( versus input frequency will then be generated and from this, the relative SNR values of the band-pass filter is observable.
Test Data:
This test data compares the TPIC8101 and a competitor’s device to show how the differences in band-pass filters affect the device performance and SNR. Both the TI device and competitor’s device were configured the same way as shown in Table 1.
| Byte | Data | Configuration | Value | Configured as |
|---|---|---|---|---|
| 1st | 0100 0110 | Prescaler | 11 | 8MHz |
| 2nd | 1110 0001 | MUX | 1 | Ch2 |
| 3rd | 0010 1001 | BPF | 41 | 6.94Khz |
| 4th | 1100 0000 | Integration Time Constant | 0 | 40uS |
| 5th | 1010 0010 | Amplifier Gain | 34 | 0.381 |
Table 2 shows test data of the amplitude of the output signal with input signals of various frequencies. Each device’s band-pass filter is programmed to have a center frequency of 6.94kHz, so input signals farther away from this center frequency should be rejected.
| Amplitude (V) at 1KHz | Amplitude (V) at 3KHz | Amplitude (V) at 6KHz | Amplitude (V) at 7KHz | Amplitude (V) at8KHz | Amplitude (V) at10KHz | Amplitude (V) at50KHz | ||
|---|---|---|---|---|---|---|---|---|
| TPIC8101 | Max | 0.53 | 1.12 | 3.36 | 3.84 | 2.72 | 2.04 | 0.6 |
| Mid | 0.4 | 0.76 | 1.84 | 2.32 | 1.84 | 1.4 | 0.47 | |
| Min | 0.34 | 0.68 | 1.44 | 1.84 | 1.36 | 1 | 0.4 | |
| Competitor’s Device | Max | 0.5 | 0.5 | 2.52 | 2.88 | 2.08 | 0.72 | 0.5 |
| Mid | 0.3 | 0.25 | 1.16 | 1.6 | 1.22 | 0.06 | 0.2 | |
| Min | 0.04 | 0.04 | 0.56 | 1 | 0.48 | 0 | 0 | |
The formula for SNR is:

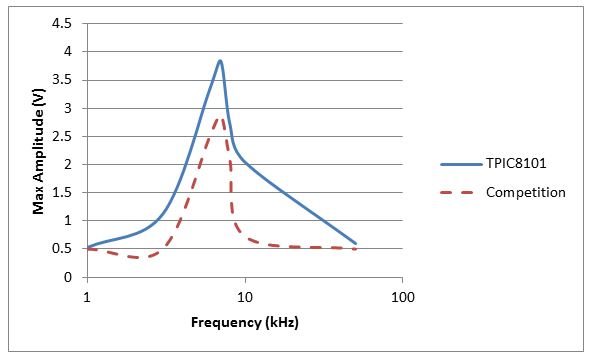
Figure 2 plots the results from Table 1. The noise level () is approximately the same between the two parts because the amplitude far away from the center frequency is about the same. At the center frequency, the TPIC8101 has a higher amplitude (meaning that its SNR is better than the competition).
 Figure 2 Test Results – Amplitude vs
Frequency Comparison with Competition
Figure 2 Test Results – Amplitude vs
Frequency Comparison with CompetitionSummary:
The band-pass filter is a critical component of the TPIC8101. It is easily tested and can serve as a benchmark comparison between two similar devices. The test data shows that the TPIC8101’s band-pass filter rejects noise very well and compares favorably to competition.