SLVAES8 May 2020 DRV8424 , DRV8424E , DRV8426 , DRV8428 , DRV8428E , DRV8434 , DRV8434E , DRV8434S , DRV8436 , DRV8436E , DRV8889-Q1
2 Details of the Test Setup
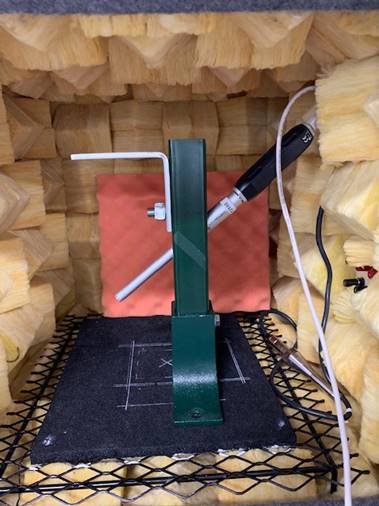
In this application report, several measurements were taken to demonstrate the effectiveness of different settings in stepper motor drivers in reducing the motor noise. Sound pressure level (SPL) was used as one method of measurement. SPL is the measurement of local pressure deviation from the ambient pressure caused by a sound wave. SPL is represented graphically with sound in decibels (dB) versus frequency. To obtain the SPL plots shown in this application report, a microphone and a stepper motor driven by a DRV8424 driver were placed inside an acoustic chamber. The audible noise from the stepper motor was recorded at various operating conditions to obtain SPL plots. Figure 3 shows a picture of the microphone inside the chamber. The details of the setup are as follows:
- The motor was securely mounted on rubber to minimize extra vibrations.
- The stepper motor is rated for 2.3 A, has 1.8° step angle, 1.9 mH inductance and 0.93 Ω resistance.
- A calibrated USB microphone was used for recording the noise.
- First, a few seconds ( approximately 5 sec) of ambient noise was captured to use as reference.
- Then, a few seconds (approximately 5-10 secs) of audio was recorded while the motor was spinning.
- The files from the audio recording were imported to a software to obtain the SPL plots.
 Figure 3. Audible Noise Measurement Setup