SLVAE22A July 2018 – March 2019 TPS54334 , TPS65251 , TPS65251-1 , TPS65251-2 , TPS65251-3 , TPS652510 , TPS65261 , TPS65263 , TPS65263-1Q1 , TPS65263-Q1 , TPS65265 , TPS65266 , TPS65266-1 , TPS65270 , TPS65273V , TPS65276V , TPS65279 , TPS65279V
5.1 TPS65261 Measured GM-PS and Se
TPS65261 is a triple synchronous BUCK converter that is widely used in the market. The BUCK1 is selected to perform this verification. Set the application condition to the following:
- 12 V VIN
- 3.3 V VOUT
- 3 A loading
- 609 KHz FSW
- 4.7 µH inductor
- 2 × 22 µF COUT
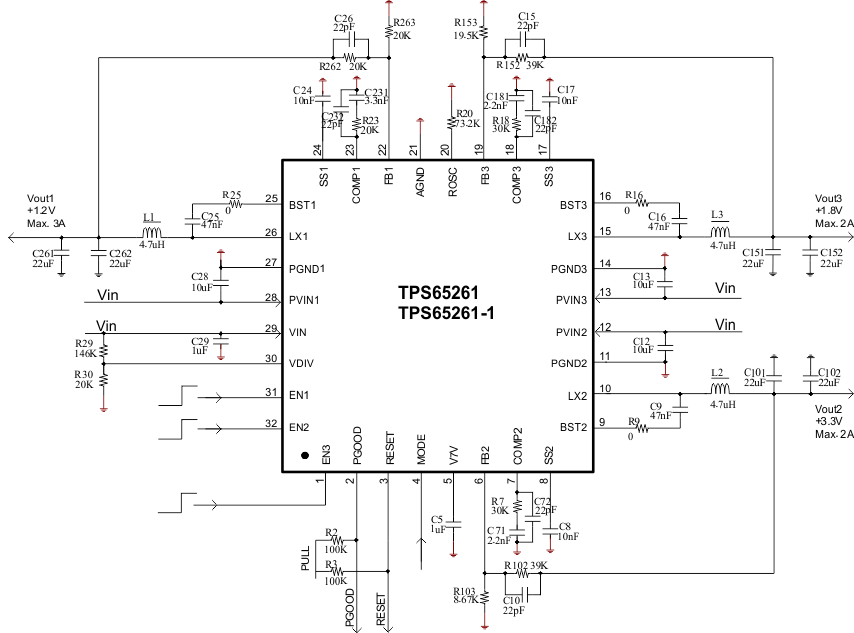
Figure 5 shows the TPS65261 typical application circuit. R263 is changed to 10 kΩ and R262 is changed to 45.3 kΩ for the VOUT = 3.3 V setting. Due to the influence of parasitic parameters and measurement accuracy, the results shift slightly, so the average value is used for general purpose analysis.
 Figure 5. TPS65261 Typical Application Circuit
 Table 3 shows a step-by-step power stage gain (GM-PS) calculation. The average GM-PS is 7.59 A/V and it is approximately equal to 7.4 A/V provided in the TPS6526x 4.5 V to 18 V Input Voltage, 3A/2A/2A Output Current Triple Synchronous Step-Down Converter Data Sheet .
Table 3. GM-PS Calculation
| STEP 1 | STEP 2 | STEP 3 | ||
|---|---|---|---|---|
| VCOMP(V) | iLoad(A) | Delta VCOMP(V) | Delta iLoad(A) | GM-PS(A/V) |
| 0.6075 | 0.50 | |||
| 0.6400 | 0.75 | 0.0325 | 0.25 | 7.692 |
| 0.6719 | 1.00 | 0.0319 | 0.25 | 7.837 |
| 0.7040 | 1.25 | 0.0321 | 0.25 | 7.788 |
| 0.7356 | 1.50 | 0.0316 | 0.25 | 7.911 |
| 0.7680 | 1.75 | 0.0324 | 0.25 | 7.716 |
| 0.8009 | 2.00 | 0.0329 | 0.25 | 7.599 |
| 0.8343 | 2.25 | 0.0334 | 0.25 | 7.485 |
| 0.8678 | 2.50 | 0.0335 | 0.25 | 7.463 |
| 0.9023 | 2.75 | 0.0345 | 0.25 | 7.246 |
| 0.9372 | 3.00 | 0.0349 | 0.25 | 7.163 |
| Average Power Stage Gain GM-PS | 7.590 | |||
Table 4 shows a step-by-step slope compensation (Se) calculation. The average Se is 1.86E+05 V/S.
Table 4. Se Calculation
| STEP 1 | STEP 2 | STEP 3 | STEP 4 | ||||
|---|---|---|---|---|---|---|---|
| VIN(V) | VCOMP(V) | Calculated TON(uS) | Calculated iLpp(A) | Delta VCOMP(V) | Delta VIN(V) | Delta iLpp(A) | Calculated Se(V/S) |
| 4.5 | 0.9727 | 1.204 | 0.307 | ||||
| 5 | 0.9409 | 1.084 | 0.392 | -0.0318 | 0.5 | 0.042 | 2.18E+05 |
| 5.5 | 0.9165 | 0.985 | 0.461 | -0.0244 | 0.5 | 0.035 | 2.01E+05 |
| 6 | 0.8972 | 0.903 | 0.519 | -0.0193 | 0.5 | 0.029 | 1.89E+05 |
| 6.5 | 0.8812 | 0.834 | 0.568 | -0.0160 | 0.5 | 0.024 | 1.84E+05 |
| 7 | 0.8668 | 0.774 | 0.609 | -0.0144 | 0.5 | 0.021 | 1.96E+05 |
| 7.5 | 0.8541 | 0.722 | 0.646 | -0.0127 | 0.5 | 0.018 | 2.00E+05 |
| 8 | 0.8432 | 0.677 | 0.677 | -0.0109 | 0.5 | 0.016 | 1.95E+05 |
| 8.5 | 0.8340 | 0.637 | 0.705 | -0.0092 | 0.5 | 0.014 | 1.85E+05 |
| 9 | 0.8259 | 0.602 | 0.730 | -0.0081 | 0.5 | 0.012 | 1.82E+05 |
| 9.5 | 0.8187 | 0.570 | 0.752 | -0.0072 | 0.5 | 0.011 | 1.81E+05 |
| 10 | 0.8119 | 0.542 | 0.772 | -0.0068 | 0.5 | 0.010 | 1.92E+05 |
| 10.5 | 0.8061 | 0.516 | 0.791 | -0.0058 | 0.5 | 0.009 | 1.79E+05 |
| 11 | 0.8009 | 0.493 | 0.807 | -0.0052 | 0.5 | 0.008 | 1.75E+05 |
| 11.5 | 0.7961 | 0.471 | 0.822 | -0.0048 | 0.5 | 0.008 | 1.78E+05 |
| 12 | 0.7918 | 0.452 | 0.836 | -0.0043 | 0.5 | 0.007 | 1.73E+05 |
| 12.5 | 0.7878 | 0.433 | 0.849 | -0.0040 | 0.5 | 0.006 | 1.75E+05 |
| 13 | 0.7842 | 0.417 | 0.860 | -0.0036 | 0.5 | 0.006 | 1.70E+05 |
| 13.5 | 0.7807 | 0.401 | 0.871 | -0.0035 | 0.5 | 0.005 | 1.80E+05 |
| 14 | 0.7774 | 0.387 | 0.881 | -0.0033 | 0.5 | 0.005 | 1.84E+05 |
| Average Slope Compensation Se | 1.86E+05 | ||||||