ZHCSFM8A December 2011 – October 2016 TPS53313
PRODUCTION DATA.
- 1 特性
- 2 应用
- 3 说明
- 4 修订历史记录
- 5 Pin Configuration and Functions
- 6 Specifications
- 7 Detailed Description
- 8 Application and Implementation
- 9 Power Supply Recommendations
- 10Layout
- 11器件和文档支持
- 12机械、封装和可订购信息
封装选项
机械数据 (封装 | 引脚)
- RGE|24
散热焊盘机械数据 (封装 | 引脚)
- RGE|24
订购信息
6 Specifications
6.1 Absolute Maximum Ratings
over operating free-air temperature range (unless otherwise noted)(1)(2)(3)| MIN | MAX | UNIT | |||
|---|---|---|---|---|---|
| Input voltage | VIN | –0.3 | 20 | V | |
| VBST | –0.3 | 27 | |||
| VBST to SW | –0.3 | 7 | |||
| SW (bidirectional) | DC | –2 | 20 | ||
| transient < 20 ns | –3 | 20 | |||
| EN | VVIN ≥ 17 | –0.3 | 17 | ||
| VVIN < 17 | –0.3 | VVIN + 0.1 | |||
| FB, MODE/SS | –0.3 | 3.6 | |||
| Output voltage | COMP, RT/SYNC, BP3 | –0.3 | 3.6 | V | |
| BP7 | –0.3 | 7 | |||
| PGD | –0.3 | 17 | |||
| Ground pin (GND) | –0.3 | 0.3 | V | ||
| Output current | 6 | A | |||
| Operating temperature, TJ | –40 | 150 | °C | ||
| Storage temperature, Tstg | –55 | 150 | °C | ||
(1) Stresses beyond those listed under Absolute Maximum Ratings may cause permanent damage to the device. These are stress ratings only, which do not imply functional operation of the device at these or any other conditions beyond those indicated under Recommended Operating Conditions. Exposure to absolute-maximum-rated conditions for extended periods may affect device reliability.
(2) All voltage values are with respect to the network ground terminal unless otherwise noted.
(3) Voltage values are with respect to the corresponding LL terminal.
6.2 ESD Ratings
| VALUE | UNIT | |||
|---|---|---|---|---|
| V(ESD) | Electrostatic discharge | Human-body model (HBM), per ANSI/ESDA/JEDEC JS-001(1) | ±2000 | V |
| Charged-device model (CDM), per JEDEC specification JESD22-C101(2) | ±500 | |||
(1) JEDEC document JEP155 states that 500-V HBM allows safe manufacturing with a standard ESD control process.
(2) JEDEC document JEP157 states that 250-V CDM allows safe manufacturing with a standard ESD control process.
6.3 Recommended Operating Conditions
over operating free-air temperature range (unless otherwise noted)(1)(2)| MIN | MAX | UNIT | ||||
|---|---|---|---|---|---|---|
| Input voltage | VIN (main supply) | 4.5 | 16 | V | ||
| VBST | –0.1 | 22 | ||||
| VBST to SW | –0.1 | 6.5 | ||||
| SW (bidirectional) | dc | –1 | 18 | |||
| transient < 20 ns | –2 | 18 | ||||
| EN | –0.1 | VVIN + 0.1 | ||||
| FB, MODE/SS | –0.1 | 3.5 | ||||
| Output voltage | COMP, RT/SYNC, BP3 | –0.1 | 3.5 | V | ||
| BP7 | –0.1 | 6.5 | ||||
| PGD | –0.1 | 14 | ||||
| Ground pin (GND) | –0.1 | 0.1 | V | |||
| TA | Ambient temperature | –40 | 85 | °C | ||
| TJ | Junction temperature | –40 | 125 | °C | ||
(1) Voltage values are with respect to the corresponding LL terminal.
(2) All voltage values are with respect to the network ground terminal unless otherwise noted.
6.4 Thermal Information
| THERMAL METRIC(1) | TPS53313 | UNIT | |
|---|---|---|---|
| RGE (VQFN) | |||
| 24 PINS | |||
| RθJA | Junction-to-ambient thermal resistance | 44.1 | °C/W |
| RθJC(top) | Junction-to-case (top) thermal resistance | 35 | °C/W |
| RθJB | Junction-to-board thermal resistance | 19 | °C/W |
| ψJT | Junction-to-top characterization parameter | 0.5 | °C/W |
| ψJB | Junction-to-board characterization parameter | 18.8 | °C/W |
| RθJC(bot) | Junction-to-case (bottom) thermal resistance | 8.9 | °C/W |
(1) For more information about traditional and new thermal metrics, see the Semiconductor and IC Package Thermal Metrics application report.
6.5 Electrical Characteristics
over operating free-air temperature range, VVIN = 12 V, PGND = GND (unless otherwise noted)| PARAMETER | TEST CONDITIONS | MIN | TYP | MAX | UNIT | |
|---|---|---|---|---|---|---|
| INPUT SUPPLY | ||||||
| VVIN | VIN supply voltage | Nominal input voltage range | 4.5 | 16 | V | |
| VPOR | VIN POR threshold | Ramp up, EN = HIGH | 4 | 4.23 | 4.4 | V |
| VPOR(hys) | VIN POR hysteresis | 200 | mV | |||
| ISTBY | Standby current | EN = LOW, VIN = 12 V | 58 | µA | ||
| RBOOT | Bootstrap on-resistance | 10 | Ω | |||
| REFERENCE | ||||||
| VVREF | Internal precision reference voltage | 0.6 | V | |||
| TOLVREF | VREF tolerance | –1% | 1% | |||
| ERROR AMPLIFIER | ||||||
| UGBW(1) | Unity gain bandwidth | 14 | MHz | |||
| AOL(1) | Open loop gain | 80 | dB | |||
| IFBINT | FB input leakage current | Sourced from FB pin | 50 | nA | ||
| IEA(max) | Output sinking and sourcing current | 5 | mA | |||
| SR(1) | Slew rate | 5 | V/µs | |||
| ENABLE | ||||||
| RENPD(1) | Enable pulldown resistor | 800 | kΩ | |||
| VENH | EN logic high | VVIN = 4.5 V | 1.8 | V | ||
| VENHYS | EN hysteresis | VVIN = 4.5 V | 0.6 | V | ||
| IEN | EN pin current | VEN = 0 V | 1 | µA | ||
| VEN = 3.3 V | 3.3 | 5 | ||||
| VEN = 14 V | 17.8 | 27.5 | ||||
| SOFT-START | ||||||
| tSS_1 | Delay after EN asserts | EN = High | 0.65 | ms | ||
| tSS_2 | Soft start ramp_up time | 0 V ≤ VSS ≤ 0.6 V, 39-kΩ or no resistor to MODE/SS pin | 1 | ms | ||
| 0 V ≤ VSS ≤ 0.6 V, 20-kΩ or 160-kΩ resistor to MODE/SS pin | 3 | |||||
| 0 V ≤ VSS ≤ 0.6 V, 10-kΩ or 82-kΩ resistor to MODE/SS pin | 6 | |||||
| tPGDENDLY | PGD startup delay time | VSS = 0.6 V to PGD (SSOK) going high, tSS = 1 ms |
0.2 | ms | ||
| RAMP | ||||||
| Ramp amplitude | 4.5 V ≤ VVIN ≤ 14.4 V | VVIN/9 | V | |||
| 14.4 V ≤ VVIN ≤ 16 V | 1.6 | |||||
| PWM | ||||||
| tMIN(off) | Minimum OFF time | fSW = 1 MHz | 150 | ns | ||
| tMIN(on) | Minimum ON time | No load | 90 | ns | ||
| DMAX | Maximum duty cycle | fSW = 1 MHz | 80% | |||
| SWITCHING FREQUENCY | ||||||
| fSW | Switching frequency tolerance | fSW = 1 MHz, RT = 45.3 kΩ | –10% | 10% | ||
| SOFT DISCHARGE | ||||||
| RSFTDIS | Soft-discharge transistor resistance | EN = Low, VIN = 4.5 V, VOUT = 0.6 V | 120 | Ω | ||
| OVERCURRENT AND ZERO CROSSING | ||||||
| IOCPL | Overcurrent limit on high-side FET (peak) | When IOUT exceeds this threshold for 4 consecutive cycles, 2.2-nF capacitor to MODE/SS pin | 4.5 | A | ||
| When IOUT exceeds this threshold for 4 consecutive cycles, no capacitor to MODE/SS pin | 6 | A | ||||
| When IOUT exceeds this threshold for 4 consecutive cycles, 10-nF capacitor to MODE/SS pin | 9 | |||||
| IOCPH | One time overcurrent shut-off on the low-side FET (peak) | Immediately shut down when sensed current reach this value, 2.2-nF capacitor to MODE/SS pin | 4.5 | A | ||
| Immediately shut down when sensed current reach this value, no capacitor to MODE/SS pin | 6 | A | ||||
| Immediately shut down when sensed current reach this value, 10-nF capacitor to MODE/SS pin | 9 | |||||
| VZXOFF | Zero crossing comparator internal offset | SW – PGND, SKIP mode | –3 | mV | ||
| POWER GOOD | ||||||
| VPGDL | Power good low threshold | Measured at the FB pin w/r/t VREF | 80% | 83% | 86% | |
| VPGDH | Power good high threshold | Measured at the FB pin w/r/t VREF | 114% | 117% | 120% | |
| VPG(hys) | Power good hysteresis | 2 | ||||
| VIN(min_pg) | Minimum Vin voltage for valid PG at startup. | Measured at VIN with 1-mA (or 2-mA) sink current on PG pin at startup | 1 | V | ||
| VPG(pd) | Power good pull-down voltage | Pull down voltage with 4-mA sink current | 0.2 | 0.4 | V | |
| IPG(leak) | Power good leakage current | Hi-Z leakage current, apply 3.3-V in off state | 12 | 16.2 | µA | |
| OUTPUT OVERVOLTAGE AND UNDERVOLTAGE PROTECTION | ||||||
| TOVPDLY | Overvoltage protection delay time | Time from FB out of +17% of VREF to OVP fault | 2 | µs | ||
| TUVPDLY | Undervoltage protection delay time | Time from FB out of –17% of VREF to UVP fault | 10 | µs | ||
| THERMAL SHUTDOWN | ||||||
| THSD(1) | Thermal shutdown | Shutdown controller, attempt soft-stop | 130 | 140 | 150 | °C |
| THSDHYST(1) | Thermal shutdown hysteresis | Controller restarts after temperature drops | 40 | °C | ||
(1) Ensured by design. Not production tested.
6.6 Typical Characteristics
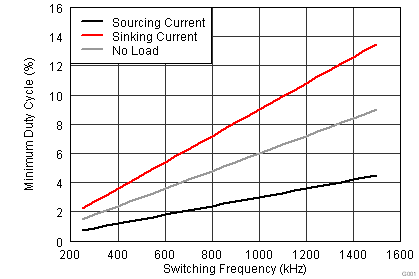 Figure 1. Ensured Minimum Duty Ratio
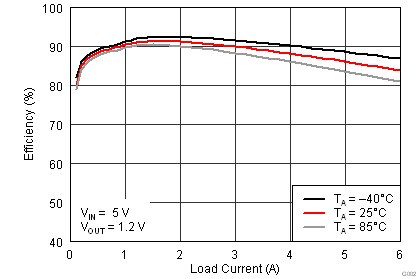 Figure 3. Efficiency, VIN = 5 V
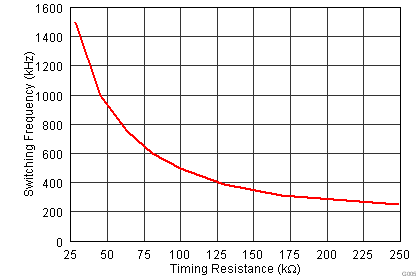 Figure 5. Switching Frequency
vs Timing Resistance (RT)
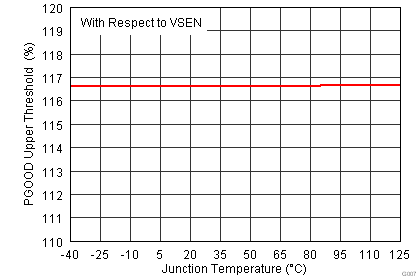 Figure 7. PGOOD Upper Threshold
vs Junction Temperature
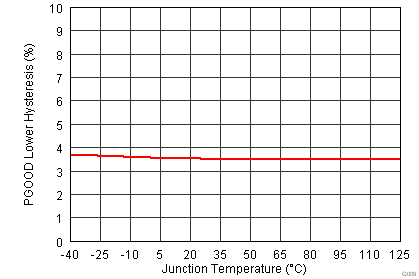 Figure 9. PGOOD Lower Hysteresis
vs Junction Temperature
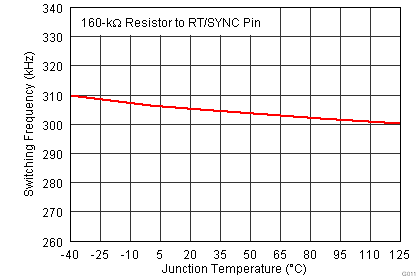 Figure 11. Switching Frequency vs Junction Temperature
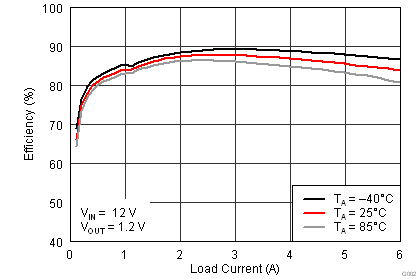 Figure 2. Efficiency, VIN = 12 V
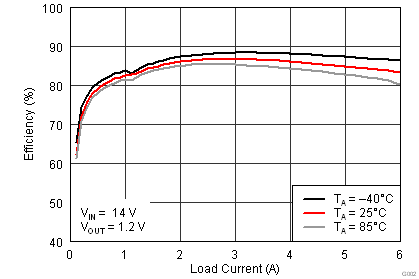 Figure 4. Efficiency, VIN = 14 V
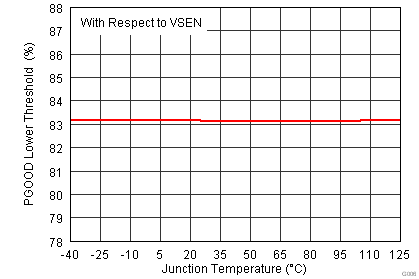 Figure 6. PGOOD Lower Threshold
vs Junction Temperature
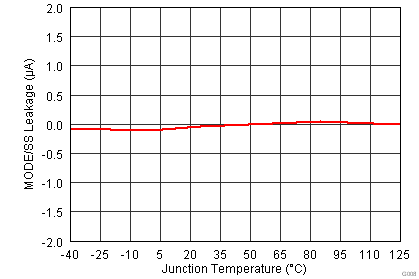 Figure 8. MODE/SS Leakage Current
vs Junction Temperature
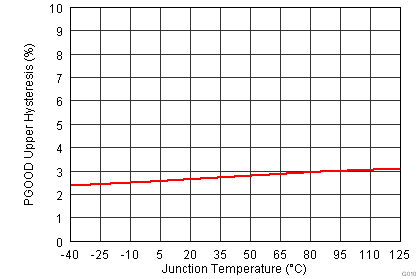 Figure 10. PGOOD Upper Hysteresis
vs Junction Temperature