• Menu
  • Product
  • Email
  • PDF
  • Order now
  • ADS7049-Q1 小型低功耗 12 位、2MSPS SAR ADC

    • ZHCSFM9 November   2016 ADS7049-Q1

      PRODUCTION DATA.  

  • CONTENTS
  • SEARCH
  • ADS7049-Q1 小型低功耗 12 位、2MSPS SAR ADC
  1. 1 特性
  2. 2 应用
  3. 3 说明
  4. 4 修订历史记录
  5. 5 Pin Configuration and Functions
  6. 6 Specifications
    1. 6.1 Absolute Maximum Ratings
    2. 6.2 ESD Ratings
    3. 6.3 Recommended Operating Conditions
    4. 6.4 Thermal Information
    5. 6.5 Electrical Characteristics
    6. 6.6 Timing Requirements
    7. 6.7 Switching Characteristics
    8. 6.8 Typical Characteristics
  7. 7 Parameter Measurement Information
    1. 7.1 Digital Voltage Levels
  8. 8 Detailed Description
    1. 8.1 Overview
    2. 8.2 Functional Block Diagram
    3. 8.3 Feature Description
      1. 8.3.1 Reference
      2. 8.3.2 Analog Input
      3. 8.3.3 ADC Transfer Function
      4. 8.3.4 Serial Interface
    4. 8.4 Device Functional Modes
      1. 8.4.1 Offset Calibration
        1. 8.4.1.1 Offset Calibration on Power-Up
        2. 8.4.1.2 Offset Calibration During Normal Operation
  9. 9 Application and Implementation
    1. 9.1 Application Information
    2. 9.2 Typical Application
      1. 9.2.1 Design Requirements
      2. 9.2.2 Detailed Design Procedure
        1. 9.2.2.1 Low Distortion Charge Kickback Filter Design
        2. 9.2.2.2 Input Amplifier Selection
        3. 9.2.2.3 Reference Circuit
      3. 9.2.3 Application Curve
  10. 10Power Supply Recommendations
    1. 10.1 AVDD and DVDD Supply Recommendations
    2. 10.2 Estimating Digital Power Consumption
    3. 10.3 Optimizing Power Consumed by the Device
  11. 11Layout
    1. 11.1 Layout Guidelines
    2. 11.2 Layout Example
  12. 12器件和文档支持
    1. 12.1 文档支持
      1. 12.1.1 相关文档 
    2. 12.2 接收文档更新通知
    3. 12.3 社区资源
    4. 12.4 商标
    5. 12.5 静电放电警告
    6. 12.6 Glossary
  13. 13机械、封装和可订购信息
  14. 重要声明
search No matches found.
  • Full reading width
    • Full reading width
    • Comfortable reading width
    • Expanded reading width
  • Card for each section
  • Card with all content


DATA SHEET

ADS7049-Q1 小型低功耗 12 位、2MSPS SAR ADC

本资源的原文使用英文撰写。 为方便起见,TI 提供了译文;由于翻译过程中可能使用了自动化工具,TI 不保证译文的准确性。 为确认准确性,请务必访问 ti.com 参考最新的英文版本(控制文档)。

1 特性

  • 适用于汽车电子 应用
  • 具有符合 AEC-Q100 的下列结果:
    • 器件温度 1 级:-40°C 至 125°C 的环境运行温度范围
    • 器件人体放电模型 (HBM) 静电放电 (ESD) 分类等级 ±2000V
    • 器件带电器件模型 (CDM) 静电放电 (ESD) 分类等级 ±1000V
  • 超低功耗:
    • 2MSPS、AVDD 为 3V 时的功耗为 1.38mW(最大值)
    • 1kSPS、AVDD 为 3V 时的功耗低于 1µW
  • 微型封装:
    • 8 引脚超薄小外形尺寸 (VSSOP) 封装:2.30mm × 2.00mm
  • 吞吐量为 2MSPS 且零延迟
  • 宽工作电压范围:
    • AVDD:2.35V 至 3.6V
    • DVDD:1.65V 至 3.6V(与 AVDD 无关)
    • 温度范围:-40°C 至 +125°C
  • 出色的性能:
    • 12 位分辨率且无丟码 (NMC)
    • ±0.5 LSB DNL;±0.5 LSB INL
    • 70dB 的信噪比 (SNR)(3V AVDD 时)
    • –80dB 的总谐波失真 (THD)(3V AVDD 时)
  • 单极输入范围:0V 至 AVDD
  • 集成偏移校准
  • 兼容 SPI 的串行接口:32MHz
  • 符合 JESD8-7A 标准的数字 I/O

2 应用

  • 车用信息娱乐
  • 车用传感器
  • 液位传感器
  • 超声波流量计
  • 电机控制
  • 便携式医疗设备

3 说明

ADS7049-Q1 器件是一款符合汽车类 Q100 标准的 12 位、2MSPS 模数转换器 (ADC)。此器件支持宽范围的模拟输入电压(2.35V 至 3.6V),并且包括一个基于电容器且内置采样保持电路的 SAR ADC。串行外设接口 (SPI) 兼容串口由 CS 和 SCLK 信号控制。输入信号在 CS 下降沿进行采样,SCLK 用于转换和串行数据输出。此器件支持宽范围的数字电源(1.65V 至 3.6V),可直接连接到各类主机控制器。ADS7049-Q1 符合 JESD8-7A 标准的标称 DVDD 范围(1.65V 至 1.95V)。

ADS7049-Q1 采用 8 引脚微型 VSSOP 封装,额定工作温度范围为 –40°C 至 +125°C。ADS7049-Q1 采样速率较快,采用微型封装并具有低功耗特性,适用于空间受限的汽车类快速扫描 应用。

器件信息(1)

部件名称 封装 封装尺寸(标称值)
ADS7049-Q1 超薄小外形尺寸封装 (VSSOP)(8) 2.30mm x 2.00mm
  1. 要了解所有可用封装,请见数据表末尾的可订购产品附录。

典型应用

ADS7049-Q1 fpd_sbas763.gif

4 修订历史记录

日期 修订版本 注释
2016 年 11 月 * 最初发布。

5 Pin Configuration and Functions

DCU Package
8-Pin Leaded VSSOP
Top View

Pin Functions

NAME NO. I/O DESCRIPTION
AINM 5 Analog input Analog signal input, negative
AINP 6 Analog input Analog signal input, positive
AVDD 7 Supply Analog power-supply input, also provides the reference voltage to the ADC
CS 4 Digital input Chip-select signal, active low
DVDD 1 Supply Digital I/O supply voltage
GND 8 Supply Ground for power supply, all analog and digital signals are referred to this pin
SCLK 2 Digital input Serial clock
SDO 3 Digital output Serial data out

6 Specifications

6.1 Absolute Maximum Ratings(1)

MIN MAX UNIT
AVDD to GND –0.3 3.9 V
DVDD to GND –0.3 3.9 V
AINP to GND –0.3 AVDD + 0.3 V
AINM to GND –0.3 0.3 V
Digital input voltage to GND –0.3 DVDD + 0.3 V
Storage temperature, Tstg –60 150 °C
(1) Stresses beyond those listed under Absolute Maximum Ratings may cause permanent damage to the device. These are stress ratings only, which do not imply functional operation of the device at these or any other conditions beyond those indicated under Recommended Operating Conditions. Exposure to absolute-maximum-rated conditions for extended periods may affect device reliability.

6.2 ESD Ratings

VALUE UNIT
V(ESD) Electrostatic discharge Human-body model (HBM), per AEC Q100-002(1) ±2000 V
Charged-device model (CDM), per AEC Q100-011 ±1000
(1) AEC Q100-002 indicates that HBM stressing shall be in accordance with the ANSI/ESDA/JEDEC JS-001 specification.

6.3 Recommended Operating Conditions

over operating free-air temperature range (unless otherwise noted)
MIN NOM MAX UNIT
AVDD Analog supply voltage range 2.35 3.6 V
DVDD Digital supply voltage range 1.65 3.6 V
TA Operating free-air temperature –40 125 °C

6.4 Thermal Information

THERMAL METRIC(1) ADS7049-Q1 UNIT
DCU (VSSOP)
8 PINS
RθJA Junction-to-ambient thermal resistance 181.8 °C/W
RθJC(top) Junction-to-case (top) thermal resistance 50.8 °C/W
RθJB Junction-to-board thermal resistance 73.9 °C/W
ψJT Junction-to-top characterization parameter 1.0 °C/W
ψJB Junction-to-board characterization parameter 73.9 °C/W
RθJC(bot) Junction-to-case (bottom) thermal resistance N/A °C/W
(1) For more information about traditional and new thermal metrics, see the Semiconductor and IC Package Thermal Metrics application report.

6.5 Electrical Characteristics

at TA = –40°C to 125°C, AVDD = 3 V, DVDD = 1.65 V to 3.6 V, fSAMPLE = 2 MSPS, and VAINM = 0 V (unless otherwise noted)
PARAMETER TEST CONDITIONS MIN TYP MAX UNIT
ANALOG INPUT
Full-scale input voltage span(1) 0 AVDD V
Absolute input voltage range AINP to GND –0.1 AVDD + 0.1 V
AINM to GND –0.1 0.1
CS Sampling capacitance 15 pF
SYSTEM PERFORMANCE
Resolution 12 Bits
NMC No missing codes 12 Bits
INL Integral nonlinearity AVDD = 3 V –1 ±0.5 1 LSB(2)
DNL Differential nonlinearity AVDD = 3 V –0.99 ±0.5 1 LSB
EO Offset error Uncalibrated ±12 LSB
Calibrated(6) AVDD = 3 V –3 ±0.5 3
dVOS/dT Offset error drift with temperature ±5 ppm/°C
EG Gain error AVDD = 3 V –0.1 ±0.05 0.1 %FS
Gain error drift with temperature No calibration ±2 ppm/°C
SAMPLING DYNAMICS
tACQ Acquisition time 90 ns
Maximum throughput rate 32-MHz SCLK, AVDD = 2.35 V to 3.6 V 2 MHz
DYNAMIC CHARACTERISTICS
SNR Signal-to-noise ratio(4) fIN = 2 kHz, AVDD = 3 V 68 70 dB
THD Total harmonic distortion(4)(3) fIN = 2 kHz, AVDD = 3 V –80 dB
SINAD Signal-to-noise and distortion(4) fIN = 2 kHz, AVDD = 3 V 67.5 69.5 dB
SFDR Spurious-free dynamic range(4) fIN = 2 kHz, AVDD = 3 V 80 dB
BW(fp) Full-power bandwidth At –3 dB, AVDD = 3 V 25 MHz
DIGITAL INPUT/OUTPUT (CMOS Logic Family)
VIH High-level input voltage(5) 0.65 × DVDD DVDD + 0.3 V
VIL Low-level input voltage(5) –0.3 0.35 × DVDD V
VOH High-level output voltage(5) At Isource = 500 µA 0.8 × DVDD DVDD V
At Isource = 2 mA DVDD – 0.45 DVDD
VOL Low-level output voltage(5) At Isink = 500 µA 0 0.2 × DVDD V
At Isink = 2 mA 0 0.45
POWER-SUPPLY REQUIREMENTS
AVDD Analog supply voltage 2.35 3 3.6 V
DVDD Digital I/O supply voltage 1.65 3 3.6 V
IAVDD Analog supply current At 2 MSPS with AVDD = 3 V 380 460 µA
IDVDD Digital supply current AVDD = 3 V, no load, no transitions 10 µA
PD Power dissipation At 2 MSPS with AVDD = 3 V 1.14 1.38 mW
(1) Ideal input span; does not include gain or offset error.
(2) LSB means least significant bit.
(3) Calculated on the first nine harmonics of the input frequency.
(4) All specifications expressed in decibels (dB) refer to the full-scale input (FSR) and are tested with an input signal 0.5 dB below full-scale, unless otherwise specified.
(5) Digital voltage levels comply with the JESD8-7A standard for DVDD from 1.65 V to 1.95 V; see the Digital Voltage Levels section for more details.
(6) See the Offset Calibration section for more details.

6.6 Timing Requirements

all specifications are at TA = –40°C to 125°C, AVDD = 2.35 V to 3.6 V, DVDD = 1.65 V to 3.6 V, and CLOAD on SDO = 20 pF (unless otherwise specified)
MIN TYP MAX UNIT
tACQ Acquisition time 90 ns
fSCLK SCLK frequency 0.016 32 MHz
tSCLK SCLK period 31.25 ns
tPH_CK SCLK high time 0.45 0.55 tSCLK
tPL_CK SCLK low time 0.45 0.55 tSCLK
tPH_CS CS high time 30 ns
tSU_CSCK Setup time: CS falling to SCLK falling 12 ns
tD_CKCS Delay time: last SCLK falling to CS rising 10 ns

6.7 Switching Characteristics

all specifications are at TA = –40°C to 125°C, AVDD = 2.35 V to 3.6 V, DVDD = 1.65 V to 3.6 V, and CLOAD on SDO = 20 pF (unless otherwise specified)
PARAMETER TEST CONDITIONS MIN TYP MAX UNIT
fTHROUGHPUT Throughput 2 MSPS
tCYCLE Cycle time 0.5 µs
tCONV Conversion time 12.5 × tSCLK + tSU_CSCK ns
tDV_CSDO Delay time: CS falling to data enable 10 ns
tD_CKDO Delay time: SCLK falling to (next) data valid on DOUT AVDD = 2.35 V to 3.6 V 25 ns
tDZ_CSDO Delay time: CS rising to DOUT going to tri-state 5 ns
ADS7049-Q1 tim_spi_bas608_B.gif Figure 1. Timing Diagram

6.8 Typical Characteristics

at TA = 25°C, AVDD = 3 V, DVDD = 1.8 V, and fSAMPLE = 2 MSPS (unless otherwise noted)
ADS7049-Q1 D001_SBAS763.gif
SNR = 70.29 dB, THD = –84.04 dB, fIN = 2 kHz,
number of samples = 65536
Figure 2. Typical FFT
ADS7049-Q1 D003_SBAS763.gif
fIN = 2 kHz
Figure 4. SNR and SINAD vs Temperature
ADS7049-Q1 D005_SBAS763.gif
fIN = 2 kHz
Figure 6. SNR and SINAD vs Reference Voltage (AVDD)
ADS7049-Q1 D007_SBAS763.gif
fIN = 2 kHz
Figure 8. SFDR vs Temperature
ADS7049-Q1 D009_SBAS763.gif
Figure 10. SFDR vs Input Frequency
ADS7049-Q1 D011_SBAS763.gif
fIN = 2 kHz
Figure 12. SFDR vs Reference Voltage (AVDD)
ADS7049-Q1 D013_SBAS763.gif
Figure 14. Offset vs Temperature
ADS7049-Q1 D015_SBAS763.gif
Figure 16. Gain Error vs Temperature
ADS7049-Q1 D017_SBAS763.gif
AVDD = 3 V
Figure 18. Typical DNL
ADS7049-Q1 D021_SBAS763.gif
Figure 20. DNL vs Temperature
ADS7049-Q1 D023_SBAS763.gif
Figure 22. INL vs Temperature
ADS7049-Q1 D025_SBAS763.gif
fSample = 2 MSPS
Figure 24. AVDD Supply Current vs Temperature
ADS7049-Q1 D027_SBAS763.gif
fSample = 2 MSPS
Figure 26. AVDD Supply Current vs Supply Voltage
ADS7049-Q1 D029_SBAS763.gif
fIN = 2 kHz
Figure 28. ENOB vs Sampling Rate
ADS7049-Q1 D031_SBAS763.gif
fIN = 2 kHz
Figure 30. SINAD vs Sampling Rate
ADS7049-Q1 D002_SBAS763.gif
SNR = 69.92 dB, THD = –80.05 dB, fIN = 250 kHz,
number of samples = 65536
Figure 3. Typical FFT
ADS7049-Q1 D004_SBAS763.gif
Figure 5. SNR and SINAD vs Input Frequency
ADS7049-Q1 D006_SBAS763.gif
fIN = 2 kHz
Figure 7. THD vs Temperature
ADS7049-Q1 D008_SBAS763.gif
Figure 9. THD vs Input Frequency
ADS7049-Q1 D010_SBAS763.gif
fIN = 2 kHz
Figure 11. THD vs Reference Voltage (AVDD)
ADS7049-Q1 D012_SBAS763.gif
Mean code = 2046.92, sigma = 0.42
Figure 13. DC Input Histogram
ADS7049-Q1 D014_SBAS763.gif
Figure 15. Offset vs Reference Voltage (AVDD)
ADS7049-Q1 D016_SBAS763.gif
Figure 17. Gain Error vs Reference Voltage (AVDD)
ADS7049-Q1 D018_SBAS763.gif
AVDD = 3 V
Figure 19. Typical INL
ADS7049-Q1 D022_SBAS763.gif
Figure 21. DNL vs Reference Voltage (AVDD)
ADS7049-Q1 D024_SBAS763.gif
Figure 23. INL vs Reference Voltage (AVDD)
ADS7049-Q1 D026_SBAS763.gif
Figure 25. AVDD Supply Current vs Throughput
ADS7049-Q1 D028_SBAS763.gif
Figure 27. AVDD Static Current vs Temperature
ADS7049-Q1 D030_SBAS763.gif
fIN = 2 kHz
Figure 29. SNR vs Sampling Rate
ADS7049-Q1 D032_SBAS763.gif
fIN = 2 kHz
Figure 31. THD vs Sampling Rate

7 Parameter Measurement Information

7.1 Digital Voltage Levels

The device complies with the JESD8-7A standard for DVDD from 1.65 V to 1.95 V. Figure 32 shows voltage levels for the digital input and output pins.

ADS7049-Q1 pmi_voltage_levels_sbas763.gif Figure 32. Digital Voltage Levels as per the JESD8-7A Standard

8 Detailed Description

8.1 Overview

The ADS7049-Q1 is an ultra-low-power, miniature analog-to-digital converter (ADC) that supports a wide analog input range. The analog input range for the device is defined by the AVDD supply voltage. The device samples the input voltage across the AINP and AINM pins on the CS falling edge and starts the conversion. The clock provided on the SCLK pin is used for conversion and data transfer. During conversions, both the AINP and AINM pins are disconnected from the sampling circuit. After the conversion completes, the sampling capacitors are reconnected across the AINP and AINM pins and the ADS7049-Q1 enters acquisition phase.

The device has an internal offset calibration. The offset calibration can be initiated by the user either on power-up or during normal operation; see the Offset Calibration section for more details.

The device also provides a simple serial interface to the host controller and operates over a wide range of digital power supplies. The ADS7049-Q1 requires only a 32-MHz SCLK for supporting a throughput of 2 MSPS. The digital interface also complies with the JESD8-7A (normal range) standard. The Functional Block Diagram section provides a block diagram of the device.

8.2 Functional Block Diagram

ADS7049-Q1 fbd_bas608.gif

8.3 Feature Description

8.3.1 Reference

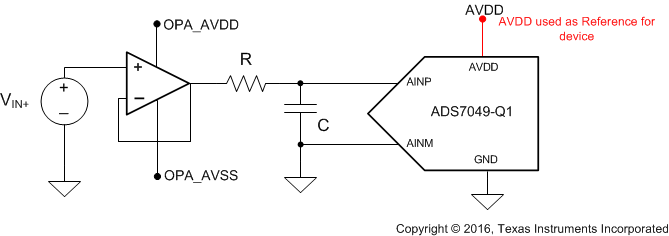
The device uses the analog supply voltage (AVDD) as a reference, as shown in Figure 33. The AVDD pin is recommended to be decoupled with a 3.3-µF, low equivalent series resistance (ESR) ceramic capacitor.. The AVDD pin functions as a switched capacitor load to the source powering AVDD. The decoupling capacitor provides the instantaneous charge required by the internal circuit and helps in maintaining a stable dc voltage on the AVDD pin. The AVDD pin is recommended to be powered with a low output impedance and low-noise regulator (such as the TPS73230).

ADS7049-Q1 ref_bas608.gif Figure 33. Reference for the Device

8.3.2 Analog Input

The device supports single-ended analog inputs. The ADC samples the difference between AINP and AINM and converts for this voltage. The device is capable of accepting a signal from –100 mV to 100 mV on the AINM input and is useful in systems where the sensor or signal-conditioning block is far from the ADC. In such a scenario, there can be a difference between the ground potential of the sensor or signal conditioner and the ADC ground. In such cases, use separate wires to connect the ground of the sensor or signal conditioner to the AINM pin. The AINP input is capable of accepting signals from 0 V to AVDD. Figure 34 represents the equivalent analog input circuits for the sampling stage. The device has a low-pass filter followed by the sampling switch and sampling capacitor. The sampling switch is represented by an RS (typically 50 Ω) resistor in series with an ideal switch and CS (typically 15 pF) is the sampling capacitor. The ESD diodes are connected from both analog inputs to AVDD and ground.

ADS7049-Q1 ain_bas608.gif Figure 34. Equivalent Input Circuit for the Sampling Stage

The analog input full-scale range (FSR) is equal to the reference voltage of the ADC. The reference voltage for the device is equal to the analog supply voltage (AVDD). Thus, the device FSR can be determined by Equation 1:

Equation 1. FSR = VREF = AVDD

8.3.3 ADC Transfer Function

The device output is in straight binary format. The device resolution for a single-ended input can be computed by Equation 2:

Equation 2. 1 LSB = VREF / 2N

where

  • VREF = AVDD and
  • N = 12

Figure 35 and Table 1 show the ideal transfer characteristics for the device.

ADS7049-Q1 ai_transfer_chara_bas608.gif Figure 35. Ideal Transfer Characteristics

Table 1. Transfer Characteristics

INPUT VOLTAGE (AINP – AINM) CODE DESCRIPTION IDEAL OUTPUT CODE
≤1 LSB NFSC Negative full-scale code 000
1 LSB to 2 LSBs NFSC + 1 — 001
(VREF / 2) to (VREF / 2) + 1 LSB MC Mid code 800
(VREF / 2) + 1 LSB to (VREF / 2) + 2 LSBs MC + 1 — 801
≥ VREF – 1 LSB PFSC Positive full-scale code FFF

8.3.4 Serial Interface

The device supports a simple, SPI-compatible interface to the external host. The CS signal defines one conversion and serial transfer frame. A frame starts with a CS falling edge and ends with a CS rising edge. The SDO pin outputs the ADC conversion results. Figure 36 shows a detailed timing diagram for the serial interface. A minimum delay of tSU_CSCK must elapse between the CS falling edge and the first SCLK falling edge. The device uses the clock provided on the SCLK pin for conversion and data transfer. The conversion result is available on the SDO pin with the first two bits set to 0, followed by 12 bits of the conversion result. The first zero is launched on the SDO pin on the CS falling edge. Subsequent bits (starting with another 0 followed by the conversion result) are launched on the SDO pin on subsequent SCLK falling edges. The SDO output remains low after 14 SCLKs. A CS rising edge ends the frame and brings the serial data bus to tri-state. For acquisition of the next sample, a minimum time of tACQ must be provided after the conversion of the current sample is completed. For details on timing specifications, see the Timing Requirements table.

The device initiates an offset calibration on the first CS falling edge after power-up and the SDO output remains low during the first serial transfer frame after power-up. For further details, see the Offset Calibration section.

ADS7049-Q1 ai_timing_bas608_B.gif Figure 36. Serial Interface Timing Diagram

8.4 Device Functional Modes

8.4.1 Offset Calibration

The ADS7049-Q1 includes a feature to calibrate the device internal offset. During offset calibration, the analog input pins (AINP and AINM) are disconnected from the sampling stage. The device includes an internal offset calibration register (OCR) that stores the offset calibration result. The OCR is an internal register and cannot be accessed by the user through the serial interface. The OCR is reset to zero on power-up. Therefore, it is recommended to calibrate the offset on power-up in order to bring the offset error within the specified limits. If the operating temperature or analog supply voltage reflect a significant change, the offset can be recalibrated during normal operation. Figure 37 shows the offset calibration process.

ADS7049-Q1 dev_offset_sd_bas608.gif
1. See the Timing Requirements section for timing specifications.
2. See the Offset Calibration During Normal Operation section for details.
3. See the Offset Calibration on Power-Up section for details.
4. The power recycle on the AVDD supply is required to reset the offset calibration and to bring the device to a power-up state.
Figure 37. Offset Calibration

8.4.1.1 Offset Calibration on Power-Up

The device initiates offset calibration on the first CS falling edge after power-up and calibration completes if the CS pin remains low for at least 16 SCLK falling edges after the first CS falling edge. The SDO output remains low during calibration. The minimum acquisition time must be provided after calibration for acquiring the first sample. If the device is not provided with at least 16 SCLKs during the first serial transfer frame after power-up, the OCR is not updated. Table 2 provides the timing parameters for offset calibration on power-up.

For subsequent samples, the device adjusts the conversion results with the value stored in the OCR. The conversion result adjusted with the value stored in OCR is provided by the device on the SDO output. Figure 38 shows the timing diagram for offset calibration on power-up.

Table 2. Offset Calibration on Power-Up

MIN TYP MAX UNIT
fCLK-CAL SCLK frequency for calibration 16 MHz
tPOWERUP-CAL Calibration time at power-up 15 × tSCLK ns
tACQ Acquisition time 90 ns
tPH_CS CS high time tACQ ns
tSU_CSCK Setup time: CS falling to SCLK falling 12 ns
tD_CKCS Delay time: last SCLK falling to CS rising 10 ns
ADS7049-Q1 cal_16clk_pwr_up_bas608.gif Figure 38. Offset Calibration on Power-Up Timing Diagram

8.4.1.2 Offset Calibration During Normal Operation

Offset calibration can be done during normal device operation if at least 32 SCLK falling edges are provided in one serial transfer frame. During the first 14 SCLKs, the device converts the sample acquired on the CS falling edge and provides data on the SDO output. The device initiates the offset calibration on the 17th SCLK falling edge and calibration completes on the 32nd SCLK falling edge. The SDO output remains low after the 14th SCLK falling edge and SDO goes to tri-state after CS goes high. If the device is provided with less than 32 SCLKs during a serial transfer frame, the OCR is not updated. Table 3 provides the timing parameters for offset calibration during normal operation.

For subsequent samples, the device adjusts the conversion results with the value stored in the OCR. The conversion result adjusted with the value stored in the OCR is provided by the device on the SDO output. Figure 39 shows the timing diagram for offset calibration during normal operation.

Table 3. Offset Calibration During Normal Operation

MIN TYP MAX UNIT
fCLK-CAL SCLK frequency for calibration 16 MHz
tCAL Calibration time during normal operation 15 × tSCLK ns
tACQ Acquisition time 90 ns
tPH_CS CS high time tACQ ns
tSU_CSCK Setup time: CS falling to SCLK falling 12 ns
tD_CKCS Delay time: last SCLK falling to CS rising 10 ns
ADS7049-Q1 cal_32clk_bas608_B.gif Figure 39. Offset Calibration During Normal Operation Timing Diagram

9 Application and Implementation

NOTE

Information in the following applications sections is not part of the TI component specification, and TI does not warrant its accuracy or completeness. TI’s customers are responsible for determining suitability of components for their purposes. Customers should validate and test their design implementation to confirm system functionality.

9.1 Application Information

The two primary circuits required to maximize the performance of a SAR ADC are the input driver and the reference driver circuits. This section details some general principles for designing the input driver circuit, reference driver circuit, and provides some application circuits designed for the ADS7049-Q1.

9.2 Typical Application

ADS7049-Q1 apps_ckt_sbas763.gif Figure 40. Single-Supply DAQ with the ADS7049-Q1

9.2.1 Design Requirements

The goal of this application is to design a single-supply digital acquisition (DAQ) circuit based on the ADS7049-Q1 with SNR greater than 70 dB and THD less than –80 dB for input frequencies of 2 kHz at a throughput of 2 MSPS.

9.2.2 Detailed Design Procedure

The input driver circuit for a high-precision ADC mainly consists of two parts: a driving amplifier and a charge kickback filter. Careful design of the front-end circuit is critical to meet the linearity and noise performance of a high-precision ADC.

9.2.2.1 Low Distortion Charge Kickback Filter Design

Figure 41 shows the input circuit of a typical SAR ADC. During the acquisition phase, the SW switch closes and connects the sampling capacitor (CSH) to the input driver circuit. This action introduces a transient on the input pins of the SAR ADC. An ideal amplifier with 0 Ω of output impedance and infinite current drive can settle this transient in zero time. For a real amplifier with non-zero output impedance and finite drive strength, this switched capacitor load can create stability issues.

ADS7049-Q1 apps_aaf_sbas763.gif Figure 41. Charge Kickback Filter

For ac signals, the filter bandwidth must be kept low to band limit the noise fed into the ADC input, thereby increasing the SNR of the system. Besides filtering the noise from the front-end drive circuitry, the RC filter also helps attenuate the sampling charge injection from the switched-capacitor input stage of the ADC. A filter capacitor, CFLT, is connected across the ADC inputs. This capacitor helps reduce the sampling charge injection and provides a charge bucket to quickly charge the internal sample-and-hold capacitors during the acquisition process. As a rule of thumb, the value of this capacitor is at least 20 times the specified value of the ADC sampling capacitance. For this device, the input sampling capacitance is equal to 15 pF. Thus, the value of CFLT is greater than 300 pF. Select a COG- or NPO-type capacitor because these capacitor types have a high-Q, low-temperature coefficient, and stable electrical characteristics under varying voltages, frequency, and time.

Note that driving capacitive loads can degrade the phase margin of the input amplifiers, thus making the amplifier marginally unstable. To avoid amplifier stability issues, series isolation resistors (RFLT) are used at the output of the amplifiers. A higher value of RFLT is helpful from the amplifier stability perspective, but adds distortion as a result of interactions with the nonlinear input impedance of the ADC. Distortion increases with source impedance, input signal frequency, and input signal amplitude. Therefore, the selection of RFLT requires balancing the stability and distortion of the design.

The input amplifier bandwidth is typically much higher than the cutoff frequency of the antialiasing filter. Thus, a SPICE simulation is strongly recommended to be performed to confirm that the amplifier has more than 40° phase margin with the selected filter. Simulation is critical because even with high-bandwidth amplifiers, some amplifiers can require more bandwidth than others to drive similar filters.

9.2.2.2 Input Amplifier Selection

To achieve a SINAD greater than 70 dB, the operational amplifier must have high bandwidth in order to settle the input signal within the acquisition time of the ADC. The operational amplifier must have low noise to keep the total system noise below 20% of the input-referred noise of the ADC. For the application circuit illustrated in Figure 40, the OPA365-Q1 is selected for its high bandwidth (50 MHz) and low noise (4.5 nV/√Hz).

For a step-by-step design procedure for a low-power, small form-factor digital acquisition (DAQ) circuit based on similar SAR ADCs, see the Three 12-Bit Data Acquisition Reference Designs Optimized for Low Power and Ultra-Small Form Factor TI Precision Design.

9.2.2.3 Reference Circuit

The analog supply voltage of the device is also used as a voltage reference for conversion. The AVDD pin is recommended to be decoupled with a 3.3-µF, low-ESR ceramic capacitor.

9.2.3 Application Curve

Figure 42 shows the FFT plot for the ADS7049-Q1 with a 2-kHz input frequency used for the circuit in Figure 40.

ADS7049-Q1 D001_SBAS763.gif
SNR = 70.6 dB, THD = –86 dB, SINAD = 70.2 dB, number of samples = 32768
Figure 42. Test Results for the ADS7049-Q1 and OPA365-Q1 for a 2-kHz Input

10 Power Supply Recommendations

10.1 AVDD and DVDD Supply Recommendations

The ADS7049-Q1 has two separate power supplies: AVDD and DVDD. The device operates on AVDD; DVDD is used for the interface circuits. AVDD and DVDD can be independently set to any value within the permissible ranges. The AVDD supply also defines the full-scale input range of the device. Always set the AVDD supply to be greater than or equal to the maximum input signal to avoid saturation of codes. Decouple the AVDD and DVDD pins individually with 3.3-µF ceramic decoupling capacitors, as shown in Figure 43.

ADS7049-Q1 ai_supply_bas608.gif Figure 43. Power-Supply Decoupling

10.2 Estimating Digital Power Consumption

The current consumption from the DVDD supply depends on the DVDD voltage, load capacitance on the SDO line, and the output code. The load capacitance on the SDO line is charged by the current from the SDO pin on every rising edge of the data output and is discharged on every falling edge of the data output. The current consumed by the device from the DVDD supply can be calculated by Equation 3:

Equation 3. IDVDD = C × V × f

where

  • C = Load capacitance on the SDO line
  • V = DVDD supply voltage and
  • f = Number of transitions on the SDO output

The number of transitions on the SDO output depends on the output code, and thus changes with the analog input. The maximum value of f occurs when data output on SDO change at every SCLK. SDO data changing at every SCLK results in an output code of AAAh or 555h. For an output code of AAAh or 555h at a 2-MSPS throughput, the frequency of transitions on the SDO output is 12 MHz.

For the current consumption to remain at the lowest possible value, keep the DVDD supply at the lowest permissible value and keep the capacitance on the SDO line as low as possible.

10.3 Optimizing Power Consumed by the Device

  • Keep the analog supply voltage (AVDD) as close as possible to the analog input voltage. Set AVDD to be greater than or equal to the analog input voltage of the device.
  • Keep the digital supply voltage (DVDD) at the lowest permissible value.
  • Reduce the load capacitance on the SDO output.
  • Run the device at the optimum throughput. Power consumption reduces with throughput.

11 Layout

11.1 Layout Guidelines

Figure 44 shows a board layout example for the ADS7049-Q1.

Some of the key considerations for an optimum layout with this device are:

  • Use a ground plane underneath the device and partition the printed circuit board (PCB) into analog and digital sections.
  • Avoid crossing digital lines with the analog signal path and keep the analog input signals and the reference input signals away from noise sources.
  • The power sources to the device must be clean and well-bypassed. Use 2.2-μF ceramic bypass capacitors in close proximity to the analog (AVDD) and digital (DVDD) power-supply pins.
  • Avoid placing vias between the AVDD and DVDD pins and the bypass capacitors.
  • Connect ground pins to the ground plane using short, low-impedance path.
  • Place the fly-wheel RC filters components close to the device.

Among ceramic surface-mount capacitors, COG (NPO) ceramic capacitors provide the best capacitance precision. The type of dielectric used in COG (NPO) ceramic capacitors provides the most stable electrical properties over voltage, frequency, and temperature changes.

11.2 Layout Example

ADS7049-Q1 layout_sbas763.gif Figure 44. Example Layout

12 器件和文档支持

12.1 文档支持

12.1.1 相关文档 

相关文档如下:

  • 《TPS732xx 具有反向电流保护功能的无电容 NMOS、250mA 低压降稳压器》(文献编号:SBVS037)
  • 《专为低功耗和超小型特性进行优化的三项 12 位数据采集参考设计》TI 高精度设计(文献编号:TIDU390)
  • 《OPAx314 3MHz、低功耗、低噪声、RRIO、1.8V CMOS 运算放大器》(文献编号:SBOS563)
  • 《OPAx365-Q1 50MHz 低失真、高 CMRR、轨到轨 I/O 单电源运算放大器》(文献编号:SBOS512)

12.2 接收文档更新通知

如需接收文档更新通知,请访问 www.ti.com.cn 网站上的器件产品文件夹。点击右上角的提醒我 (Alert me) 注册后,即可每周定期收到已更改的产品信息。有关更改的详细信息,请查阅已修订文档中包含的修订历史记录。

12.3 社区资源

The following links connect to TI community resources. Linked contents are provided "AS IS" by the respective contributors. They do not constitute TI specifications and do not necessarily reflect TI's views; see TI's Terms of Use.

    TI E2E™ Online Community TI's Engineer-to-Engineer (E2E) Community. Created to foster collaboration among engineers. At e2e.ti.com, you can ask questions, share knowledge, explore ideas and help solve problems with fellow engineers.
    Design Support TI's Design Support Quickly find helpful E2E forums along with design support tools and contact information for technical support.

12.4 商标

E2E is a trademark of Texas Instruments.

All other trademarks are the property of their respective owners.

12.5 静电放电警告

esds-image

ESD 可能会损坏该集成电路。德州仪器 (TI) 建议通过适当的预防措施处理所有集成电路。如果不遵守正确的处理措施和安装程序 , 可能会损坏集成电路。

ESD 的损坏小至导致微小的性能降级 , 大至整个器件故障。 精密的集成电路可能更容易受到损坏 , 这是因为非常细微的参数更改都可能会导致器件与其发布的规格不相符。

12.6 Glossary

SLYZ022 — TI Glossary.

This glossary lists and explains terms, acronyms, and definitions.

13 机械、封装和可订购信息

以下页中包括机械封装和可订购信息。这些信息是针对指定器件可提供的最新数据。这些数据会在无通知且不对本文档进行修订的情况下发生改变。欲获得该数据表的浏览器版本,请查阅左侧的导航栏。


重要声明

德州仪器(TI) 及其下属子公司有权根据 JESD46 最新标准, 对所提供的产品和服务进行更正、修改、增强、改进或其它更改, 并有权根据 JESD48最新标准中止提供任何产品和服务。客户在下订单前应获取最新的相关信息, 并验证这些信息是否完整且是最新的。所有产品的销售都遵循在订单确认时所提供的TI 销售条款与条件。

TI 保证其所销售的组件的性能符合产品销售时 TI 半导体产品销售条件与条款的适用规范。仅在 TI 保证的范围内,且 TI 认为有必要时才会使用测试或其它质量控制技术。除非适用法律做出了硬性规定,否则没有必要对每种组件的所有参数进行测试。

TI 对应用帮助或客户产品设计不承担任何义务。客户应对其使用 TI 组件的产品和应用自行负责。为尽量减小与客户产品和应用相关的风险,客户应提供充分的设计与操作安全措施。

TI 不对任何 TI 专利权、版权、屏蔽作品权或其它与使用了 TI 组件或服务的组合设备、机器或流程相关的 TI 知识产权中授予 的直接或隐含权限作出任何保证或解释。TI所发布的与第三方产品或服务有关的信息,不能构成从 TI 获得使用这些产品或服 务的许可、授权、或认可。使用此类信息可能需要获得第三方的专利权或其它知识产权方面的许可,或是 TI 的专利权或其它知识产权方面的许可。

对于 TI 的产品手册或数据表中 TI 信息的重要部分,仅在没有对内容进行任何篡改且带有相关授权、条件、限制和声明的情况 下才允许进行复制。TI 对此类篡改过的文件不承担任何责任或义务。复制第三方的信息可能需要服从额外的限制条件。

在转售 TI 组件或服务时,如果对该组件或服务参数的陈述与 TI 标明的参数相比存在差异或虚假成分,则会失去相关 TI 组件或服务的所有明示或暗示授权,且这是不正当的、欺诈性商业行为。TI 对任何此类虚假陈述均不承担任何责任或义务。

客户认可并同意,尽管任何应用相关信息或支持仍可能由 TI 提供,但他们将独力负责满足与其产品及在其应用中使用 TI 产品相关的所有法律、法规和安全相关要求。客户声明并同意,他们具备制定与实施安全措施所需的全部专业技术和知识,可预见故障的危险后果、监测故障及其后果、降低有可能造成人身伤害的故障的发生机率并采取适当的补救措施。客户将全额赔偿因 在此类安全关键应用中使用任何 TI 组件而对 TI及其代理造成的任何损失。

在某些场合中,为了推进安全相关应用有可能对 TI 组件进行特别的促销。TI 的目标是利用此类组件帮助客户设计和创立其特有的可满足适用的功能安全性标准和要求的终端产品解决方案。尽管如此,此类组件仍然服从这些条款。

TI 组件未获得用于 FDA Class III(或类似的生命攸关医疗设备)的授权许可,除非各方授权官员已经达成了专门管控此类使 用的特别协议。

只有那些 TI 特别注明属于军用等级或“增强型塑料”的 TI 组件才是设计或专门用于军事/航空应用或环境的。购买者认可并同 意,对并非指定面向军事或航空航天用途的 TI组件进行军事或航空航天方面的应用,其风险由客户单独承担,并且由客户独 力负责满足与此类使用相关的所有法律和法规要求。

TI 已明确指定符合 ISO/TS16949 要求的产品,这些产品主要用于汽车。在任何情况下,因使用非指定产品而无法达到 ISO/TS16949要求,TI不承担任何责任。

产品

  • 数字音频: www.ti.com.cn/audio
  • 放大器和线性器件: www.ti.com.cn/amplifiers
  • 数据转换器: www.ti.com.cn/dataconverters
  • DLP® 产品: www.dlp.com
  • DSP - 数字信号处理器: www.ti.com.cn/dsp
  • 时钟和计时器: www.ti.com.cn/clockandtimers
  • 接口: www.ti.com.cn/interface
  • 逻辑: www.ti.com.cn/logic
  • 电源管理: www.ti.com.cn/power
  • 微控制器 (MCU): www.ti.com.cn/microcontrollers
  • RFID 系统: www.ti.com.cn/rfidsys
  • OMAP应用处理器: www.ti.com/omap
  • 无线连通性: www.ti.com.cn/wirelessconnectivity

应用

  • 通信与电信: www.ti.com.cn/telecom
  • 计算机及周边: www.ti.com.cn/computer
  • 消费电子: www.ti.com/consumer-apps
  • 能源: www.ti.com/energy
  • 工业应用: www.ti.com.cn/industrial
  • 医疗电子: www.ti.com.cn/medical
  • 安防应用: www.ti.com.cn/security
  • 汽车电子: www.ti.com.cn/automotive
  • 视频和影像: www.ti.com.cn/video

德州仪器在线技术支持社区: www.deyisupport.com

邮寄地址: 上海市浦东新区世纪大道1568 号,中建大厦32 楼邮政编码: 200122
Copyright© 2016, 德州仪器半导体技术(上海)有限公司


Texas Instruments

© Copyright 1995-2025 Texas Instruments Incorporated. All rights reserved.
Submit documentation feedback | IMPORTANT NOTICE | Trademarks | Privacy policy | Cookie policy | Terms of use | Terms of sale