TIDT243 December 2021
6 Switching
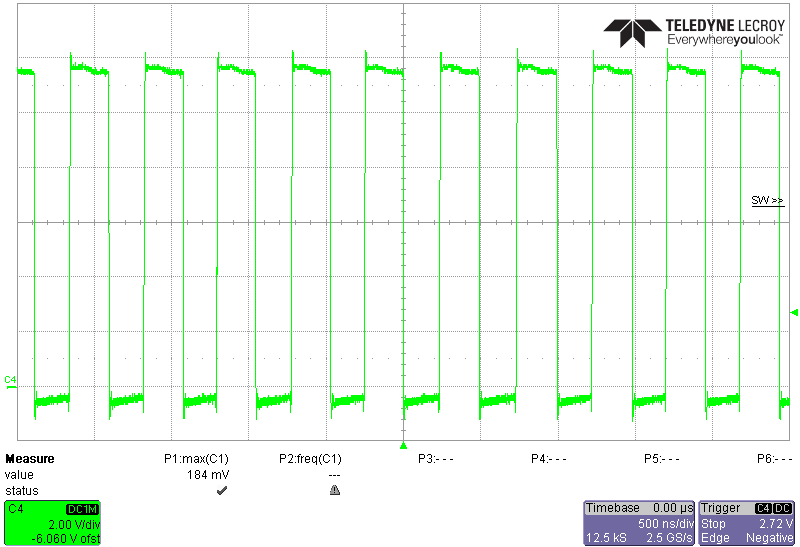
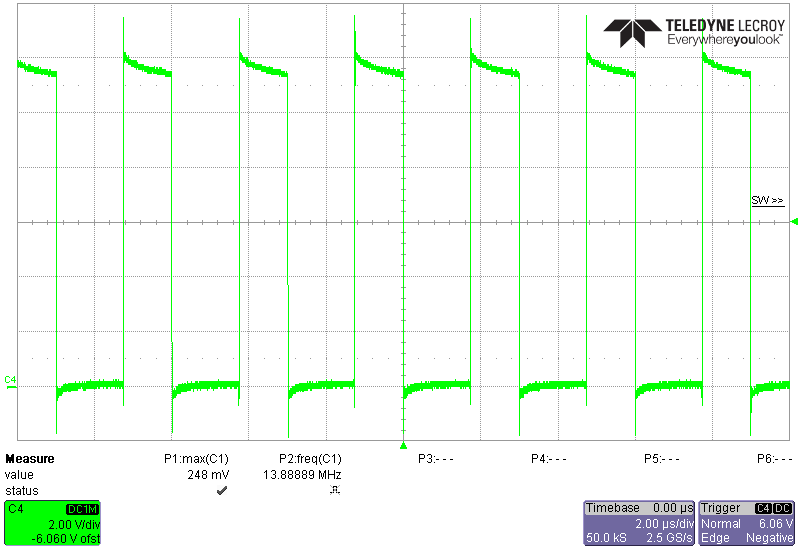
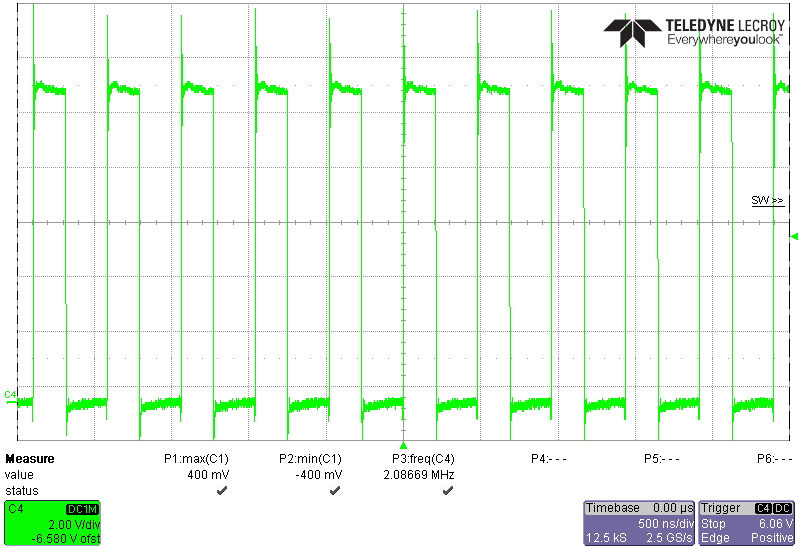
The waveforms in Figure 6-1 through Figure 6-4 were tested with 12-V input voltage.
 Figure 6-1 Part A – 3-A Load Current, 2.1 MHz
 Figure 6-2 Part B – 3-A Load Current, 2.1 MHz
 Figure 6-3 Part C – 6-A Load Current, 400 kHz
 Figure 6-4 Part C – 6-A Load Current, 2.1 MHz