SSZTAD7 march 2017 TPS717
One of the most touted benefits of low dropout linear regulators (LDOs) is their ability to attenuate voltage ripple generated by switched-mode power supplies. This is especially important for signal-conditioning devices like data converters, phase-locked loops (PLLs) and clocks, where noisy supply voltages can compromise performance. My colleague Xavier Ramus covered the detrimental effect noise has on signal-conditioning devices in the blog: Reducing high-speed signal chain power supply issues. Yet Power Supply Rejection Ratio (PSRR) is still commonly mistaken as a single, static value. In this post, I’ll attempt to illustrate what PSRR is and the variables that affect it.
Just What is PSRR?
PSRR is a common specification found in many LDO data sheets. It specifies the degree to which an AC element of a certain frequency is attenuated from the input to the output of the LDO. Equation 1 expresses PSRR as:
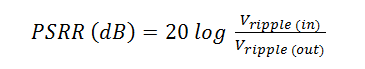
This equation tells you that the higher the attenuation, the higher the PSRR value in units of decibels. (It should be noted that some vendors apply a negative sign to indicate attenuation. Most vendors, including Texas Instruments, do not.)
It’s not uncommon to find PSRR specified in the electrical characteristics table of a data sheet at a frequency of 120Hz or 1kHz. However, this specification alone might not be so helpful in determining if a given LDO meets your filtering requirements. Let’s examine why.
Determining PSRR for Your Application
Figure 1 shows a DC/DC converter regulating 4.3V from a 12V rail. It’s followed by the TPS717, a high-PSRR LDO, regulating a 3.3V rail. The ripple generated from switching amounts to ±50mV on the 4.3V rail. The PSRR of the LDO will determine the amount of ripple remaining at the output of the TPS717.
 Figure 1 Using an LDO to Filter
Switching Noise
Figure 1 Using an LDO to Filter
Switching NoiseIn order to determine the degree of attenuation, you must first know at which frequency the ripple is occurring. Let’s assume 1MHz for this example, as it is right in the middle of the range of common switching frequencies. You can see that the PSRR value specified at 120Hz or 1kHz will not help with this analysis. Instead, you must consult the PSRR plot in Figure 2.
 Figure 2 PSRR Curve for the
TPS717 With vIN – VOUT = 1V
Figure 2 PSRR Curve for the
TPS717 With vIN – VOUT = 1VThe PSRR at 1MHz is specified at 45dB under the following conditions:
- IOUT = 150mA
- VIN – VOUT = 1V
- COUT = 1μF
Assume that these conditions match your own. In this case, 45dB equates to an attenuation factor of 178. You can expect your ±50mV ripple at the input to be squashed to ±281μV at the output.
Altering the Conditions
But let’s say that you changed the conditions and decided to reduce your VIN – VOUT delta to 250mV in order to regulate more efficiently. You would then need to consult the curve in Figure 3.
 Figure 3 PSRR Curve for the
TPS717 With vIN – VOUT =
0.25V
Figure 3 PSRR Curve for the
TPS717 With vIN – VOUT =
0.25VYou can see that holding all other conditions constant, the PSRR at 1MHz is reduced to 23dB, or an attenuation factor of 14. This is due to the CMOS pass element entering the triode (or linear) region; that is, as the VIN – VOUT delta approaches the dropout voltage, PSRR begins to degrade. (Bear in mind that dropout voltage is a function of output current, among other factors. Hence, a lower output current decreases the dropout voltage and helps improve PSRR.)
Changing the output capacitor will have implications as well, as shown in Figure 4.
 Figure 4 PSRR Curve for the
TPS717 With vIN – VOUT = 0.25V,
COUT = 10μF
Figure 4 PSRR Curve for the
TPS717 With vIN – VOUT = 0.25V,
COUT = 10μFBy sizing up the output capacitor from 1μF to 10μF, the PSRR at 1MHz increases to 42dB despite the VIN – VOUT delta remaining at 250mV. The high-frequency hump in the curve has shifted to the left. This is due to the impedance characteristics of the output capacitor(s). By sizing the output capacitor appropriately, you can tune, or increase, the attenuation to coincide with the particular switching noise frequency.
Turning All the Knobs
Just by adjusting VIN – VOUT and the output capacitance, you can improve PSRR for a particular application. These are by no means the only variables affecting PSRR, though. Table 1 outlines the various factors.
| Parameter | PSRR | ||
|---|---|---|---|
|
Low frequency (<1kHz) |
Mid frequency (1kHz – 100kHz) |
High frequency (>100kHz) |
|
| VIN – VOUT | +++ | +++ | ++ |
| Output capacitor (COUT) | No effect | + | +++ |
| Noise reduction capacitor (CNR) | +++ | + | No effect |
| Feed-forward capacitor (CFF) | ++ | +++ | + |
| PCB layout | + | + | +++ |
I will discuss these other factors in a future post. But for now, I hope that you are more familiar with the various tools at your disposal that can help you design an effective LDO filter. For more information on LDO PSRR, read the application note, LDO PSRR Measurement Simplified.