SSZTA09 july 2017 MSP430FR5994
In the final installment of this six-part smart sensing series, I would like to discuss a conceptual ultrasonic sonar system that employs a pulse-compression technique to improve target-range accuracy and range resolution.
Ultrasonic sonar uses the propagation of acoustic energy at ultrasonic frequencies to extract information from the environment. In Figure 1, the sonar transmitter sends out a pulse in order to detect a target. The range of the target is calculated from the time delay of the signal reflected from the target. In Figure 1, R is the range of the target, C is the sound propagation speed and T is the time delay of flight (DOF) of the target’s return signal.
 Figure 1 Sonar Used in Target-range
Measurement
Figure 1 Sonar Used in Target-range
MeasurementThere are two important parameters for sonar performance: range accuracy and range resolution. Range accuracy is related to the signal-to-noise ratio of the return signal. The higher the signal-to-noise ratio, the more accurate the range measurement will be. Range resolution is sonar’s ability to resolve multiple targets separated by short disturbances. A fine range resolution requires a short pulse width, which indicates high transmitter and receiver bandwidth. A high receiver signal-to-noise ratio also requires higher transmitting power.
Because sonar’s operating bandwidth and transmitting power are severely limited in the real world, pulse compression is a technique that helps overcome these limitations. In pulse compression, a specific phase or frequency pattern modulates the transmitted pulse during a wider pulse interval. The receiver uses a pulse-matched filter to correlate the reflected signal with the pattern of the outgoing signals to compress the received signal into narrow pulse and reject noise and other signals. Since the transmitted pulse is wider, a lower peak-power output transmitter can deliver the same amount of transmitted pulse energy to maintain range accuracy performance. The compressed narrow pulse also enables a finer range resolution.
Figure 2 illustrates the idea of pulse compression.
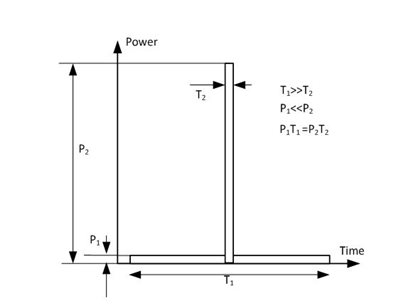 Figure 2 Concept of Pulse
Compression
Figure 2 Concept of Pulse
CompressionOne popular form of pulse-compression modulation is the linear frequency sweep, or chirp. Figure 3 illustrates the waveform of a chirp pulse.
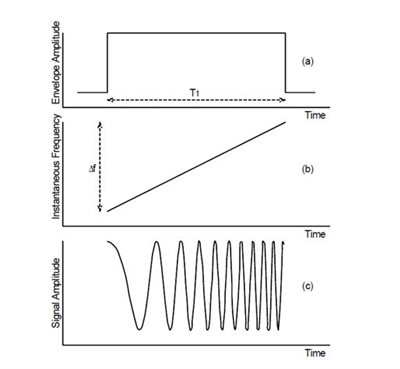 Figure 3 Waveform of a
Frequency-modulated (FM) Chirp
Figure 3 Waveform of a
Frequency-modulated (FM) ChirpIn Figure 3, T1 is the duration of the FM pulse. In the top graph, the power of the chirp is kept constant. In the middle graph, the frequency is swept by Df during chirping. In the bottom graph, the chirp signal is in the time domain. Figure 4 is a simplified block diagram of an FM chirp sonar.
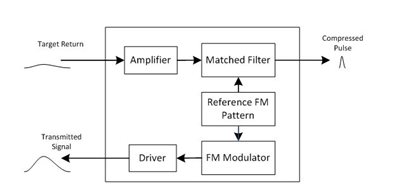 Figure 4 A Simplified Block Diagram of
an FM Chirp Sonar
Figure 4 A Simplified Block Diagram of
an FM Chirp SonarIn Figure 4, the pulse-matched filter in the receiving path is a correlation operator to produce a narrow output pulse only when the received signal contains the exact frequency chirp pattern in the transmit pulse. In this way, the wide transmitted pulse effectively compresses to a narrow pulse at the output of the correlator, as shown in Figure 5.
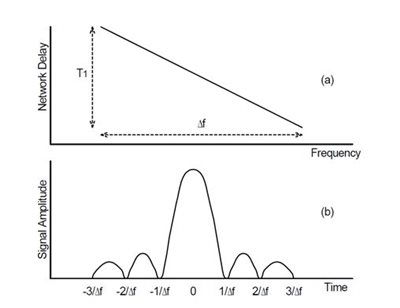 Figure 5 Compressed Pulse after Matched
Filtering
Figure 5 Compressed Pulse after Matched
FilteringThe signal-to-noise-ratio gain, known as the pulse-compression ratio, is the product of the bandwidth of the frequency sweep and the transmitted pulse width. The compressed pulse width is the inverse of the chirp bandwidth.
There are two ways to implement the matched filter. The first method is to make the matched filter a finite impulse response (FIR) filter with a time-domain FM chirp pattern as the filter coefficients. The second method first converts the time-domain inputs to the frequency domain, taking advantage of the fact that you can achieve a correlation of signals in time-domain by multiplying the spectrum’s frequency domain. The fast Fourier transform (FFT) algorithm makes the calculation efficient. Figure 6 illustrates the signal processing of FM chirp sonar in the frequency domain.
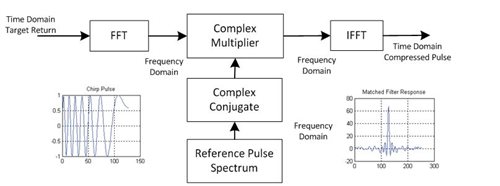 Figure 6 Implementation of an FM Chirp
Receiver
Figure 6 Implementation of an FM Chirp
ReceiverIn Figure 6, the input time-domain signal is converted to the frequency domain and multiplied by the complex conjugate of the spectrum of the reference FM chirp. The product is then converted to the time domain. In sonar applications, the length of the input data is often much larger than the duration of the transmitted chirp. This frequency-domain operation needs to be performed on overlapped input data blocks.
Robot applications and target classification applications use FM chirp sonar for its enhanced signal-to-noise ratio of the target’s return signal and its ability to detect multiple targets. Researchers have also been able to use FM chirp sonar echo to find information about the geometric structure of a target’s surface. Other researchers established range-orientation and amplitude-orientation profiles for recognizing leafy plants and human faces. Fish finders and moving aids for blind people have also used FM chirp sonar.
Figure 7 illustrates an FM chirp sonar implementation using the TI MSP430FR5994 microcontroller (MCU). To generate the FM chirp pulse for transmission, a time-domain reference table is saved in the MSP430FR5994 MCU’s ferroelectric random access memory (FRAM). A timer is set up to toggle an input/output (I/O) pin when the timer period expires to generate the excitation signal to the transmitter. The timer also generates a request upon expiration for direct memory access (DMA) to load a new period value from the FRAM reference table. Figure 8 shows the resulting excitation signal for the FM chirp.
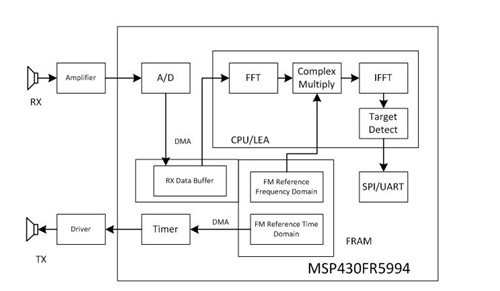 Figure 7 FM Chirp Sonar Implemented on
TI’s MSP430FR5994 MCU
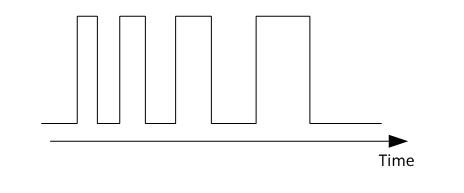 Figure 8 Excitation Signal for the FM
Chirp
Figure 8 Excitation Signal for the FM
ChirpFor this conceptual FM sonar, let’s set the duration of the FM chirp pulse to 2.56ms. The transmitter sweeps from 50kHz to 100kHz. The bandwidth of the sweep is 50kHz. The signal-to-noise-ratio gain is 75 (bandwidth-pulsewidth product, 50kHz times 2.56ms). The sound speed in the air is about 340 meters per second. The target-range resolution of the system is about 6.8mm. The analog-to-digital converter (ADC) on the MSP430FR5994 will run at 200KSPS to correctly sample the time-domain input up to 100kHz. The chirp can be repeated every 100ms.
The maximum DOF for the system is about 30ms for a 5meters maximum target range. To cover this range, the receive data will collect a total of 7,000 samples for about 35ms after the transmission chirp starts. Since the low energy accelerator (LEA) module’s RAM is not large enough for this amount of data, the “overlap-and-save” method needs to be used for processing in the frequency domain.
The first step to set up the matched filter is to create an FM frequency reference table. Sampling the 2.56ms FM chirp at 200KSPS results in a 512-point array. The next steps are to expand the array to 1,024 points by zero padding, take FFT of the expanded array and save the complex conjugate of the FFT output as the FM reference table.
The overlap-and-save method is a method to calculate correlation on large size of data using FFT. First, the large data block is divided into overlapped sub-blocks with 50% overlapping. In this conceptual system, the size of the sub-block is 1024 pts. To start processing, put 512 zeros in the first half of the 1,024-point buffer and the first 512 input data in the second half. Do a 1,024-point FFT, complex multiply FFT output with the reference table, and do inverse FFT on the result array of the multiplication. Only save the first half of the inverse FFT results to the output buffer. Now, move the first 512 input samples to the first half of the buffer and next 512 samples to the second half of the buffer.. Repeat this procedure 13 times to process all of the received samples.
Now let’s see if the LEA can get the matched filtering done in time. As I mentioned earlier, the matched filtering for this FM chirp sonar requires 13 rounds of 1,024-point FFT, complex multiply and inverse FFT. My rough estimate indicates that the LEA can complete the calculation of one round in about 6ms, with 13 rounds taking about 80ms.
DMA will move the received data from the ADC to a buffer in FRAM. DMA can interrupt the central processing unit (CPU) for the movement of each 512-sample block so that LEA processing will begin about 2.56ms after the chirp. DMA will also move data from the buffer in FRAM to LEA RAM, and move the output of LEA processing to the buffer in FRAM.
If there is a target in range, you should see a compressed pulse in the inverse FFT output buffer. The “constant false-alarm rate” is a widely used technique for target detection. This technique involves estimating a noise level from a processed signal and setting the detection threshold to be proportional to the noise level. Since the LEA handles the matched filtering, most of the CPU time can be devoted to target detection from the matched filter output.
Conclusion
This blog completes this blog series of smart sensing. The MSP430 MCU with the LEA math coprocessor opens many digital processing opportunities in ultra-low power applications. I am looking forward to feedback from readers and hope to provide more useful information in the future.
Additional Resources
- Download the white paper, “Setting a new standard for MCU performance while minimizing energy consumption
- Read Part 21, “Sonar Sensing,” from the book “Springer Handbook of Robotics.
- Read Chapter 11, “High Range Resolution Techniques,” from The University of Sydney sensor training series
- Read Chapter 13.1, “Convolution and Deconvolution Using the FFT,” from the book “Numerical Recipes in Fortran 77: The Art of Scientific Computing.”