SNOA943 January 2016 FDC2112 , FDC2112-Q1 , FDC2114 , FDC2114-Q1 , FDC2212 , FDC2212-Q1 , FDC2214 , FDC2214-Q1
- Power Reduction Techniques for the FDC2214/2212/2114/2112 in Capacitive Sensing Applications
7 Results
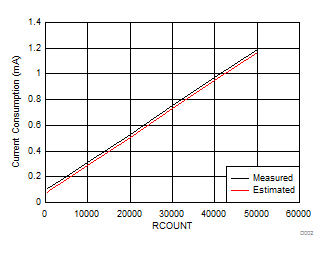
Figure 5 and Table 5 show the comparison between the experimental results and analytical results for varying values of RCOUNT.
 Figure 5. Comparison Between Measured and Estimated Current Consumption
 Table 5. Differences in Measured and Estimated Current Consumption
| RCOUNT | Duty Cycle | Measured Current,
Active State (mA) |
Estimated Current,
Active State (mA) |
Difference
(Measured – Estimated) (mA) |
|---|---|---|---|---|
| 500 | 0.42% | 0.106 | 0.079 | 0.027 |
| 1000 | 0.82% | 0.118 | 0.090 | 0.028 |
| 5000 | 4.02% | 0.205 | 0.178 | 0.027 |
| 10000 | 8.02% | 0.314 | 0.288 | 0.026 |
| 20000 | 16.02% | 0.532 | 0.508 | 0.024 |
| 30000 | 24.02% | 0.751 | 0.728 | 0.023 |
| 40000 | 32.02% | 0.969 | 0.948 | 0.021 |
| 50000 | 40.02% | 1.190 | 1.168 | 0.022 |
Based on the data above, the measured current consumption and estimated current consumption differ by an average of 25 µA, where the estimated current consumption is slightly less than the measured current consumption. This can be attributed to the fact that various other system parameters such as the sensor frequency, sensor amplitude, and sensor current drive were not taken into account in the estimation. TI provides a spreadsheet-based calculator tool, the FDC211x/FDC221x Current Consumption Estimator, which is based on the above equations and also takes into account these other parameters. This calculator tool was designed to estimate a worst-case power consumption scenario so for a real-world system, the current consumption through the device is generally less than what the calculator predicts.
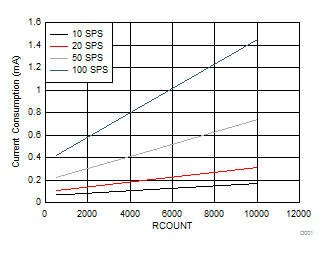
After verifying the current estimation model, a set of experiments varying RCOUNT values at different sampling rates were conducted using the experimental setup shown previously in Figure 4.
 Figure 6. Current Consumption for Varying RCOUNT Values at Specified Sampling Rates
 Figure 6 shows an approximately linear relationship between current consumption and RCOUNT. Since RCOUNT is directly related to sensor conversion time (Equation 3), a lower RCOUNT results in a shorter conversion time, tC, and allows the device to spend less time in normal mode and more time in sleep mode (per sampling period, TS). For a given sampling rate, a lower RCOUNT consumes less current while a higher RCOUNT consumes more current. Another way to understand the relationship is that if RCOUNT is kept constant but the sampling rate is varied, the FDC2214 sampling at a higher rate consumes more power than a FDC2214 sampling at a lower rate.