SLYA073 December 2022 CC1312R , DRV5032 , TMAG5273
3.1 Testing Setup Overview
This board gives the added benefit of being able to not only evaluate all sensors simultaneously, but also allows the user to observe incoming data via the universal asynchronous receiver-transmitter (UART) console. This ability allows continuous data acquisition which can then be imported into a spreadsheet tool for further analysis.
Figure 3-1 shows the testing process for the evaluation platform. Upon start-up, all sensor communications and registers are setup automatically before initiating serial printing of sensor data. Accelerometer and TMAG5273 data are streamed to the console based on a predetermined update cadence while the DRV5032 and Reed switch status is only given in the event of magnetic field detection. The DRV5032 is meant to serve as an ultra-low power switch to start TMAG5273 data, so the testing excludes the field detection of the DRV5032. See the Reed Switch Replacement with TI's Hall-effect and Linear 3D Hall-effect Sensors application note for more data on the detection field of the DRV5032.
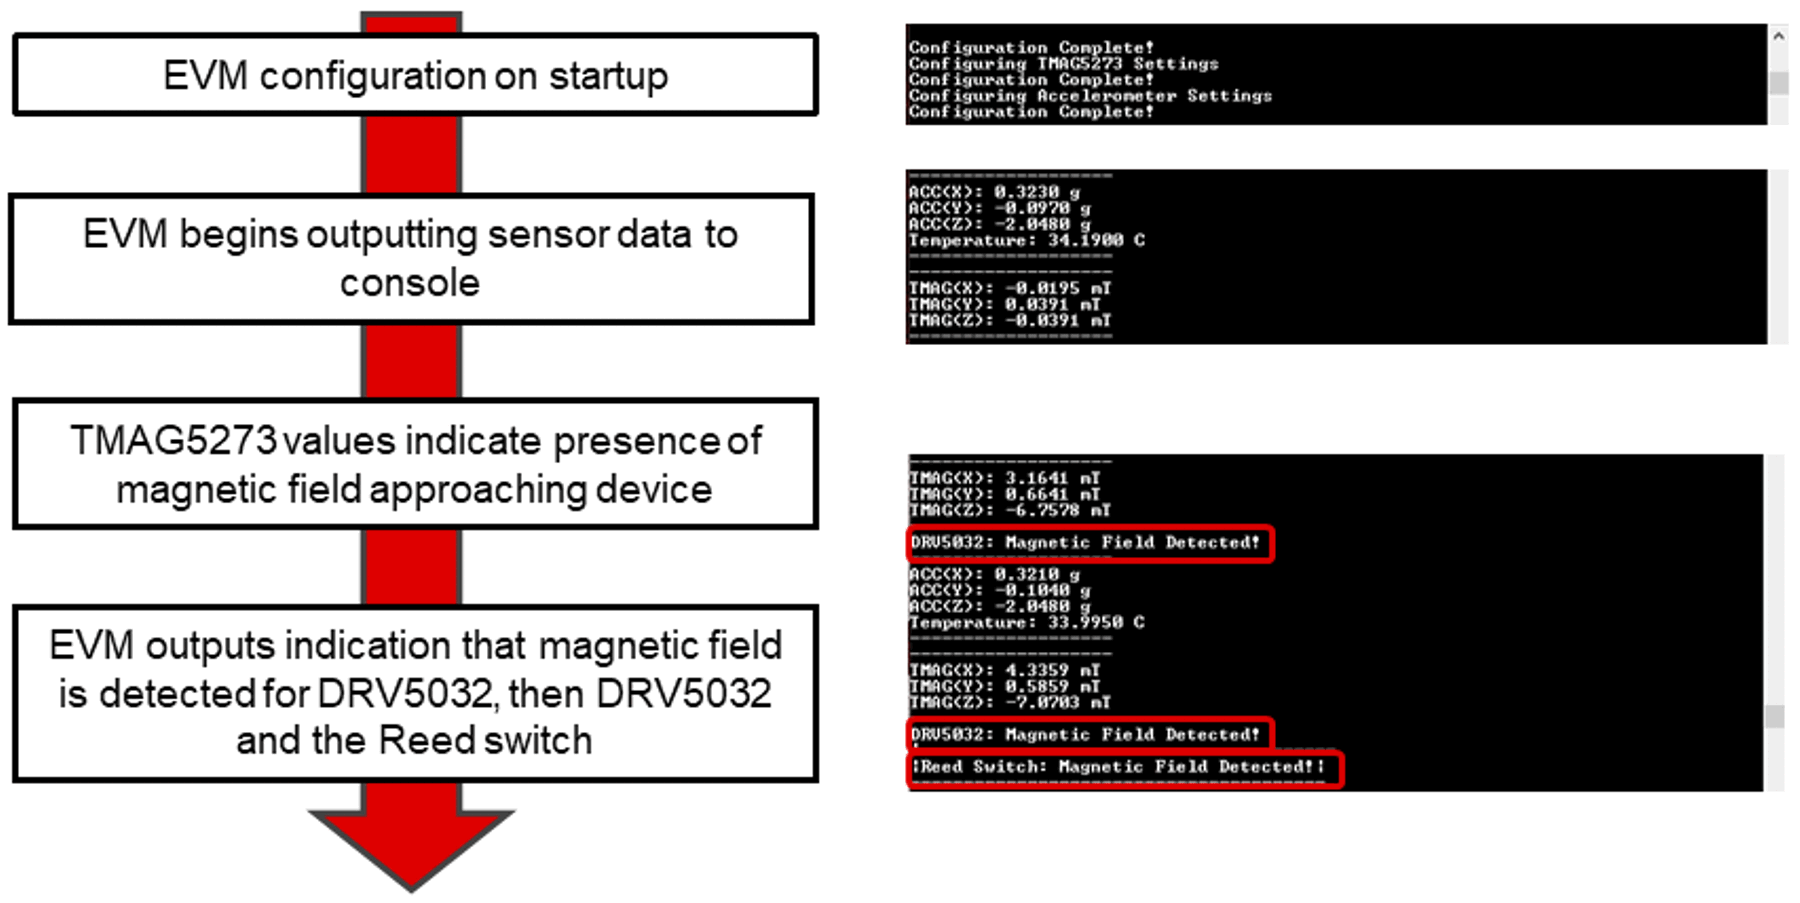 Figure 3-1 Data Acquisition
Process
Figure 3-1 Data Acquisition
ProcessThe testing done in this document is based on 2 different magnets. The first is a cylindrical magnet and the second is a rectangular magnet. The purpose of using 2 magnets is to show the influence of magnet shape and magnetization direction on the sensing field of the Reed switch and TMAG5273.
For both devices, the magnet is brought incrementally closer to the device and the distance of detection is recorded. The approach-point is incremented in the Y, Z plane and recorded for the X axis. For the TMAG5273, the output for each axis is linear so at each increment, magnitude values are given for each axis, whereas the Reed switch is a binary indication of field presence.
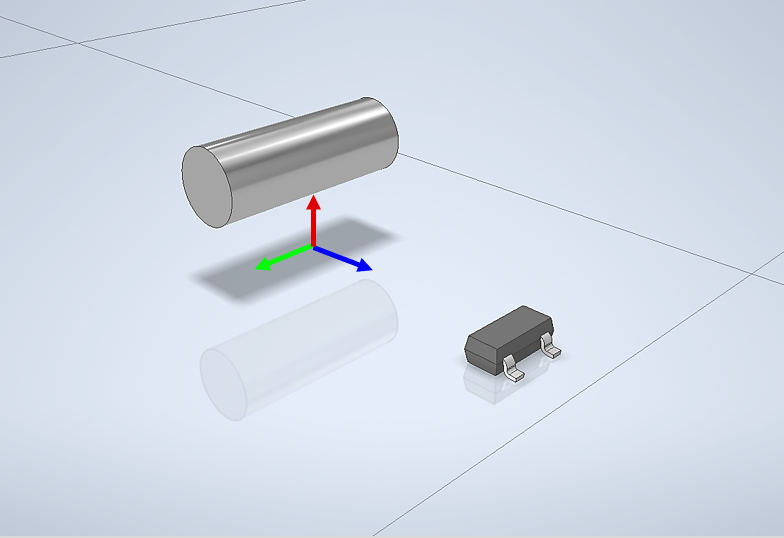 Figure 3-2 Magnet Approach Test
Example
Figure 3-2 Magnet Approach Test
ExampleThe software used in conjunction with the evaluation hardware is relatively simplistic in the sense that, for performance data collection, most of the processes are automatic, so the user can start evaluating right out of the box. There are several start-up routines that run once the board is powered up, namely establishing communications with the sensors and initializing registers with the necessary values for operation.
From this point, the main function runs through each of the sensor routines for collecting data. Due to the binary nature of both the Reed switch as well as the DRV5032, detection for these devices is indicated visually via the RGB LED schemes mentioned in the previous section, where no detection is indicated by a green LED, red is the Reed switch, and blue is the DRV5032. The TMAG5273 and accelerometer data are sent to the UART console and logged for later analysis. The update rate can be changed in the firmware based on desired report frequency, and thus can be used to control the responsiveness and granular resolution of sensor events.
The door and window sensor evaluation platform also features the ability to wirelessly collect data via the serial bridge console commands, but these additional features are outside the scope of this article. The wireless portion of the design is covered in more detail in a followup article. Section 3.2 shows the results of the testing for the TMAG5273, the Reed switch, and the accelerometer.
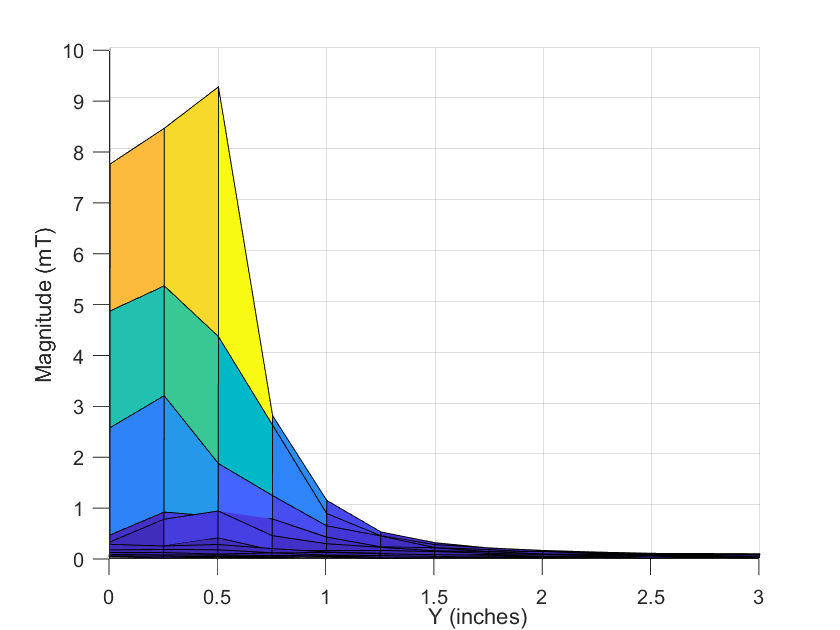 Figure 3-4 TMAG5273 Magnet 1 Detection
Field (2D)
Figure 3-4 TMAG5273 Magnet 1 Detection
Field (2D)Figure 3-4 shows the detection field of the TMAG5273 where the Z axis is magnitude in mT and the Y axis represents the nodal points used to collect data (data collected every half inch). As can be deciphered from the plot, the detection begins to appear at approximately 2 inches and increases as the magnet is brought closer to the device, peaking at 0.5 inches from the IC. The magnetic flux sensed by the TMAG5273 peaks at approximately 9.2 mT. Figure 3-5 shows a 3D view of the magnetic flux as the magnet is brought closer to the IC.
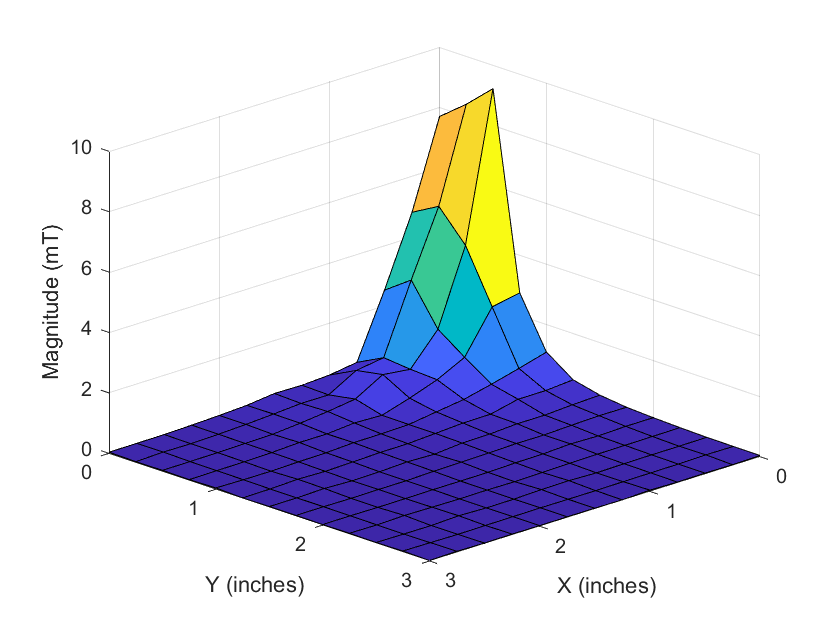 Figure 3-5 TMAG5273 Magnet 1 Detection
Field (3D)
Figure 3-5 TMAG5273 Magnet 1 Detection
Field (3D)Figure 3-6 shows the detection field for the Reed switch. The detection distance with the first magnet is maximum at the center at approximately 0.7 inches, with two lobes on either side of the center peak. The darker shaded red areas indicate detection overlap in the Z axis. This overlap is displayed more clearly in the 3D figure in Figure 3-7.
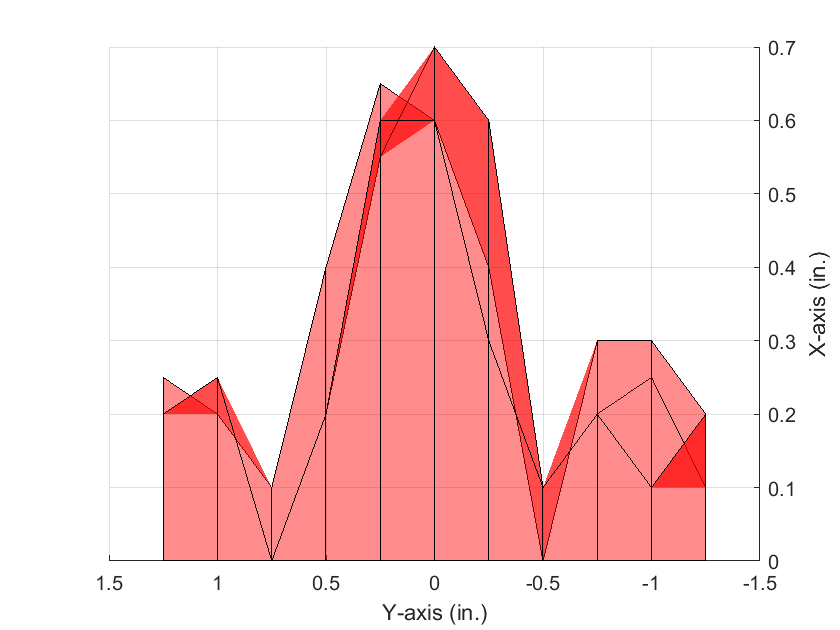 Figure 3-6 Reed Switch Magnet 1 Detection
Field (2D Top Down)
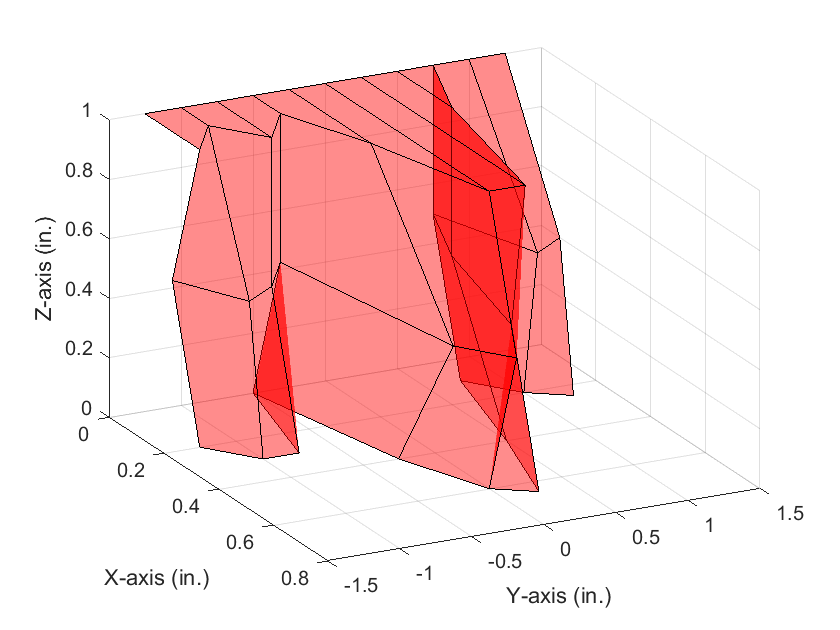 Figure 3-7 Reed Switch Magnet 1 Detection
Field (3D)
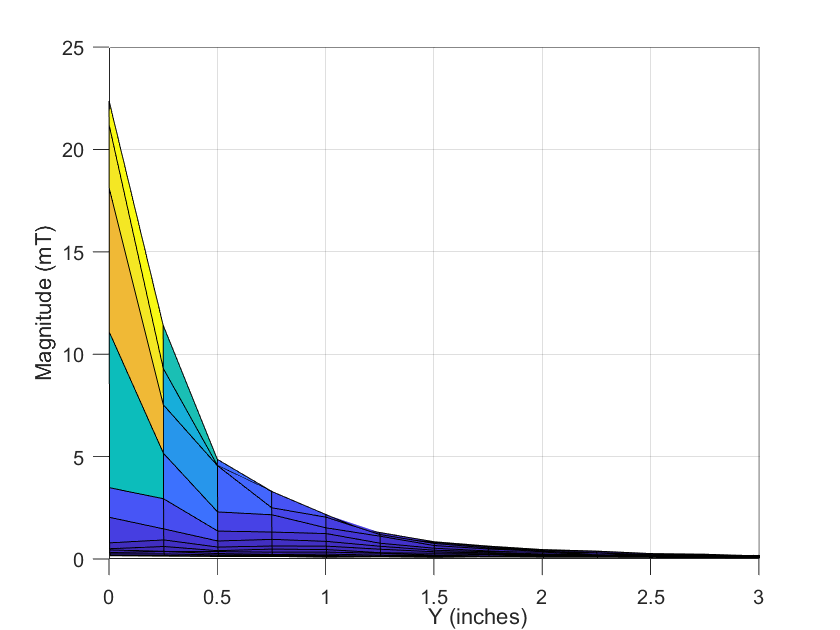 Figure 3-8 TMAG5273 Magnet 2 Detection
Field (2D)
Figure 3-8 TMAG5273 Magnet 2 Detection
Field (2D)The same testing procedure is done with a second magnet, a rectangular magnet roughly 2 in × 0.75 in × 0.5 in. For this magnet, the detection distance is slightly farther from the IC at 2.5 inches. Due to the increased magnet strength of the second magnet, the magnitude increases to almost 25 mT at the peak, and due to the shape and magnetization of the magnet used, the peak is now at the IC instead of slightly in front. Figure 3-9 shows a 3D view of the magnetic flux as the magnet is brought closer to the IC.
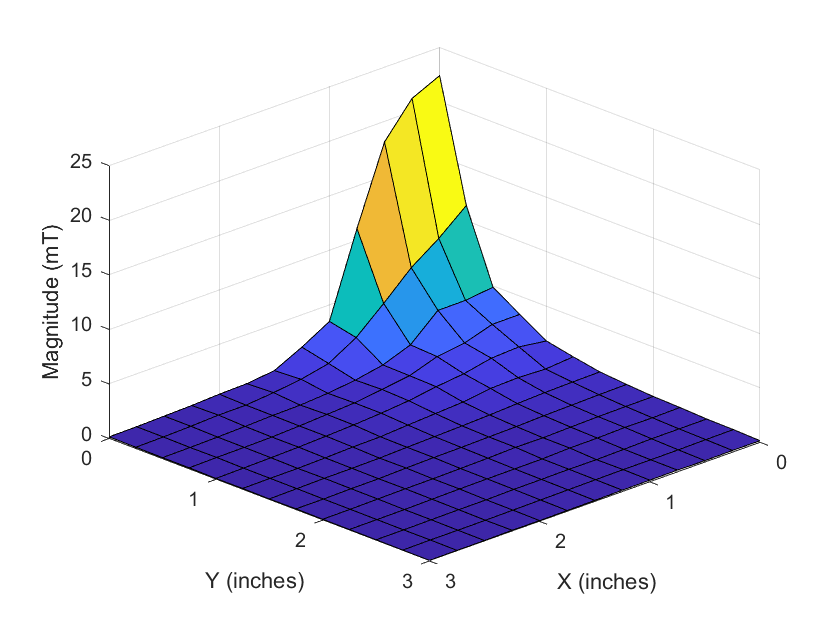 Figure 3-9 TMAG5273 Magnet 2 Detection
Field (3D)
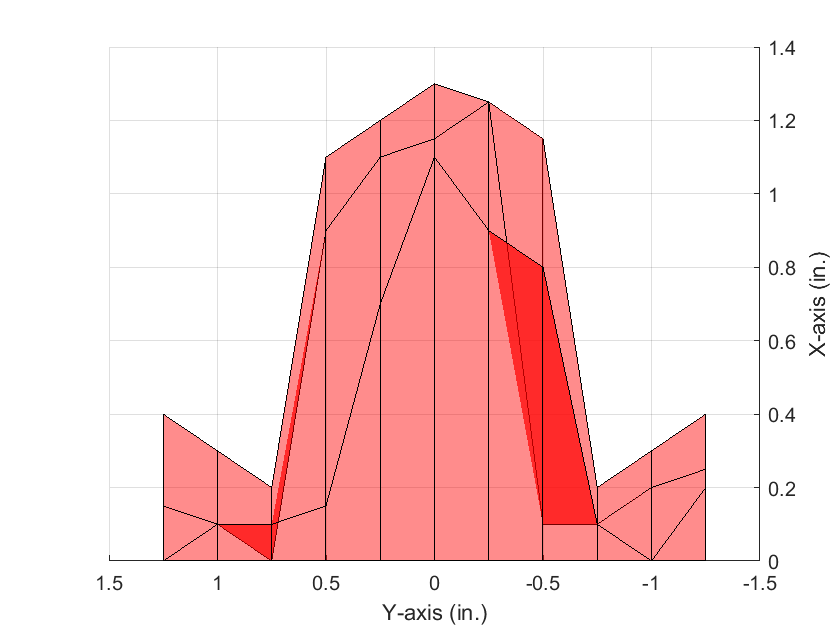 Figure 3-10 Reed Switch Magnet 2 Detection
Field (2D Top Down)
Figure 3-10 Reed Switch Magnet 2 Detection
Field (2D Top Down)The same test is done again with the Reed switch to map out the detection range of the device. As in the first Reed switch test, there are two lobes on either side of the main peak, located on the center axis of the Reed switch. Due to the stronger magnetic field, the detection distance is almost doubled at approximately 1.3 in from the switch. An offset view is also shown in Figure 3-11 to add to the visual understanding to Figure 3-10.
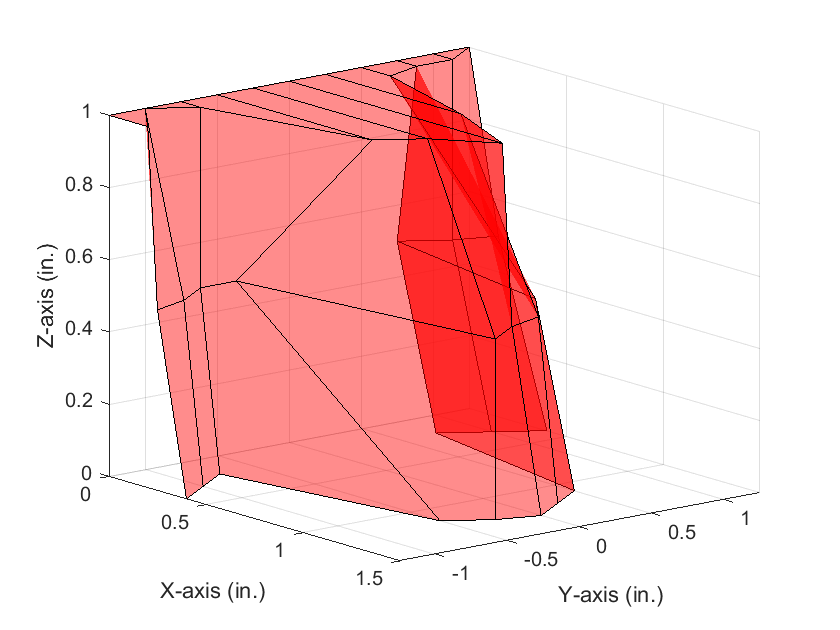 Figure 3-11 Reed Switch Magnet 2 Detection
Field (3D)