SLOA313 May 2021 AFE7070 , AFE7071
2.1 Variation Over Frequency
The CF and SBS performance are known to vary over frequency. Figure 2-1 and Figure 2-2 show the characterization data of CF and SBS performance over frequency for an unadjusted (that is, uncalibrated) case and the adjusted case where each point is optimized.
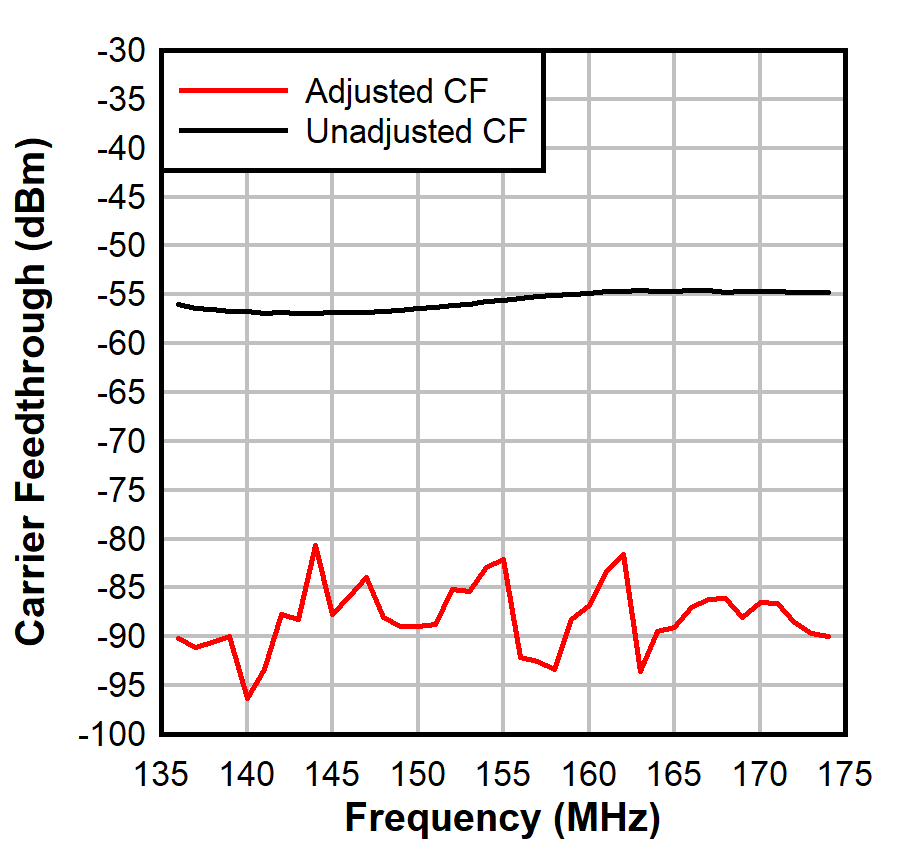 Figure 2-1 Unadjusted CF vs
Frequency
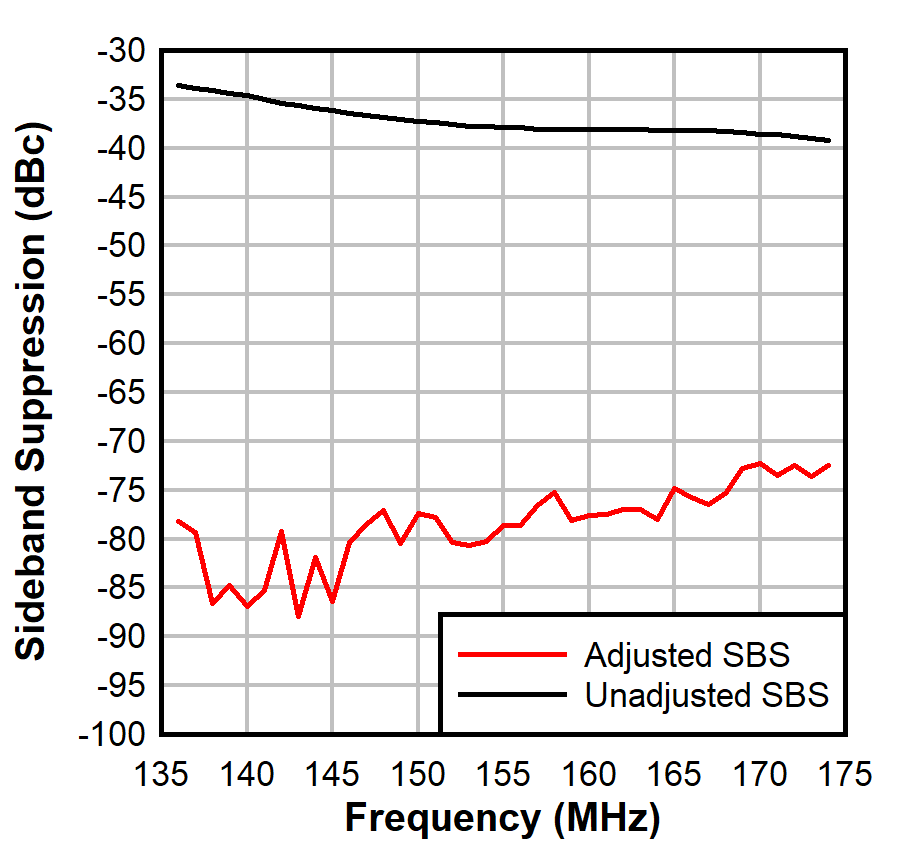 Figure 2-2 Unadjusted SBS vs
Frequency
Figure 2-2 Unadjusted SBS vs
FrequencyThe carrier feedthrough performance at the lower frequencies is inherently good. Unadjusted performance hovers around –55 dBm. With optimization, the CF performance improves to below –80 dBm. Conversely, the sideband suppression starts off at a higher level. This is understandable knowing the polyphase circuit of the device that generates the quadrature signals of the LO is operating at the edge of its designed range. It is expected to have more phase imbalance as the frequency drops. SBS performance is around –40 dBc at the high end of the band and degrades to –33 dBc at the low end of the band.
Figure 2-3 and Figure 2-4 show the optimized QMC parameters across frequency for one device. The absolute value is not important as those values are different for each device. The key observation is the slope and variability of the parameter over frequency; this indicates how well the optimization algorithm interpolates between known calibration points.
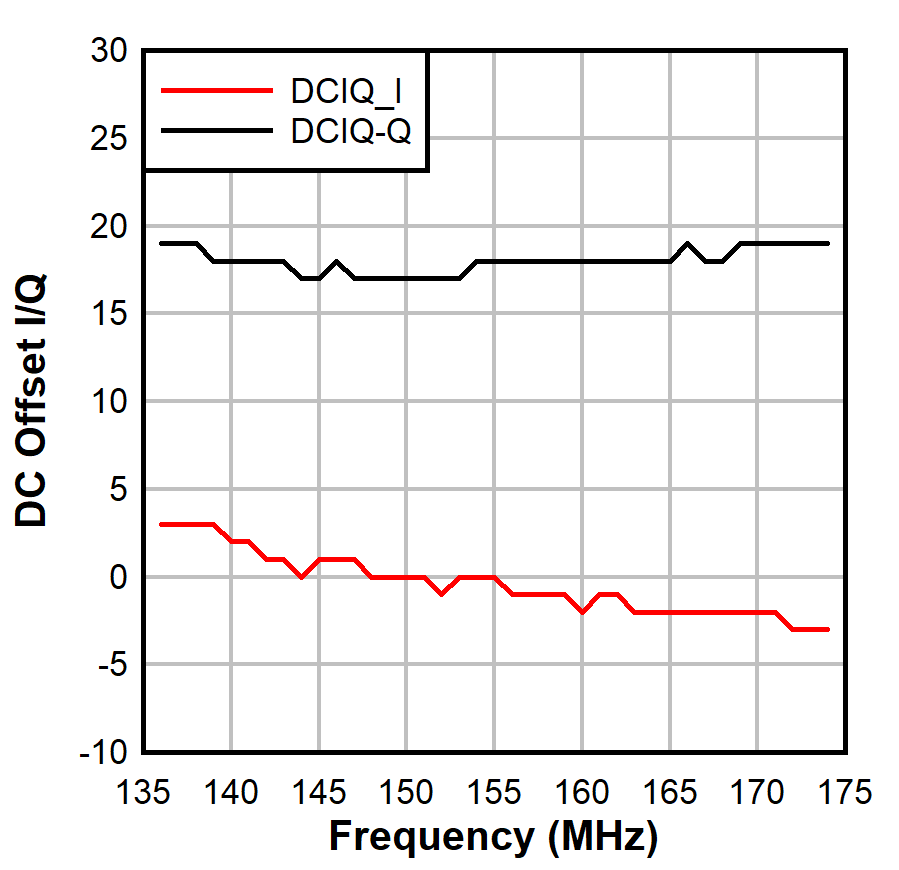 Figure 2-3 DCI/Q vs Frequency
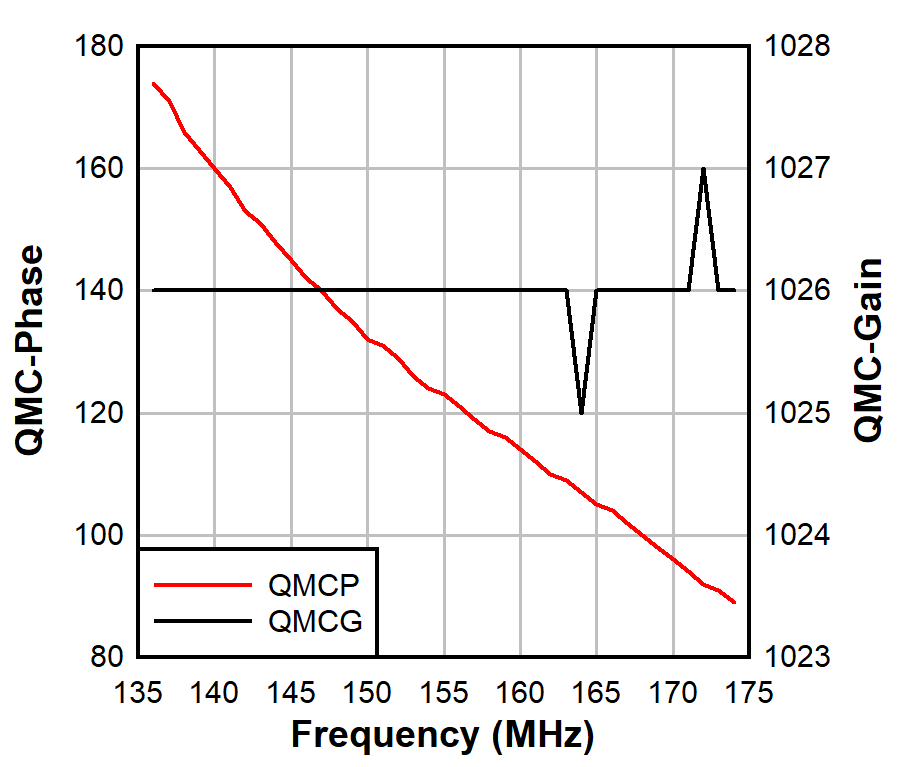 Figure 2-4 QMCP and QMCG vs
Frequency
Figure 2-4 QMCP and QMCG vs
FrequencyThe DCI/Q variation is not excessive. This is anticipated since the CF performance remains fairly consistent. The QMC-Gain is nominally at 1024. For this particular device there is a consistent gain adjustment of 2 steps from nominal with an occasional adjustment by one step higher or lower. The QMC-Phase parameter exhibits the biggest change. Technically, the curve fit of the response is a second-order polynomial, but if the response is broken into two pieces, corresponding to low and high band, each section is approximately linear with a slightly different slope. Using linear interpolation between three frequency points yields a good approximation of the optimized set-point across frequency. Similarly, linearly interpolated values between calibration points is used to determine the intermediate points for the DCI/Q and QMC-Gain. Figure 2-5 and Figure 2-6 show the corrected CF and SBS performance over frequency using just 3 calibrated points.
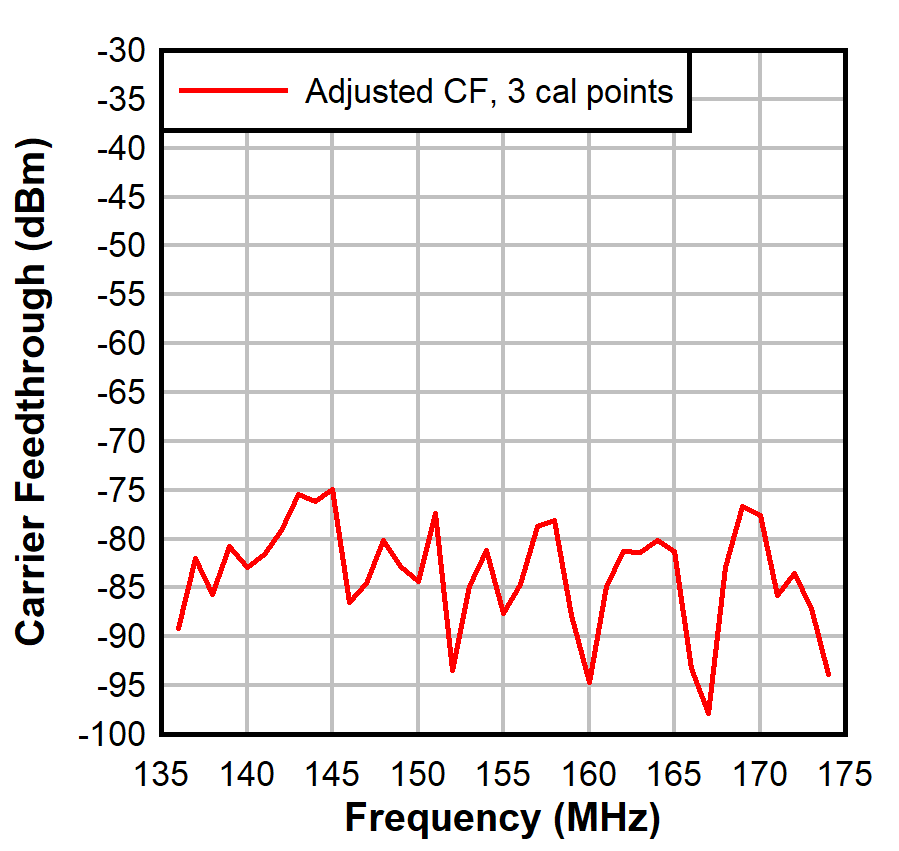 Figure 2-5 Adjusted CF vs
Frequency
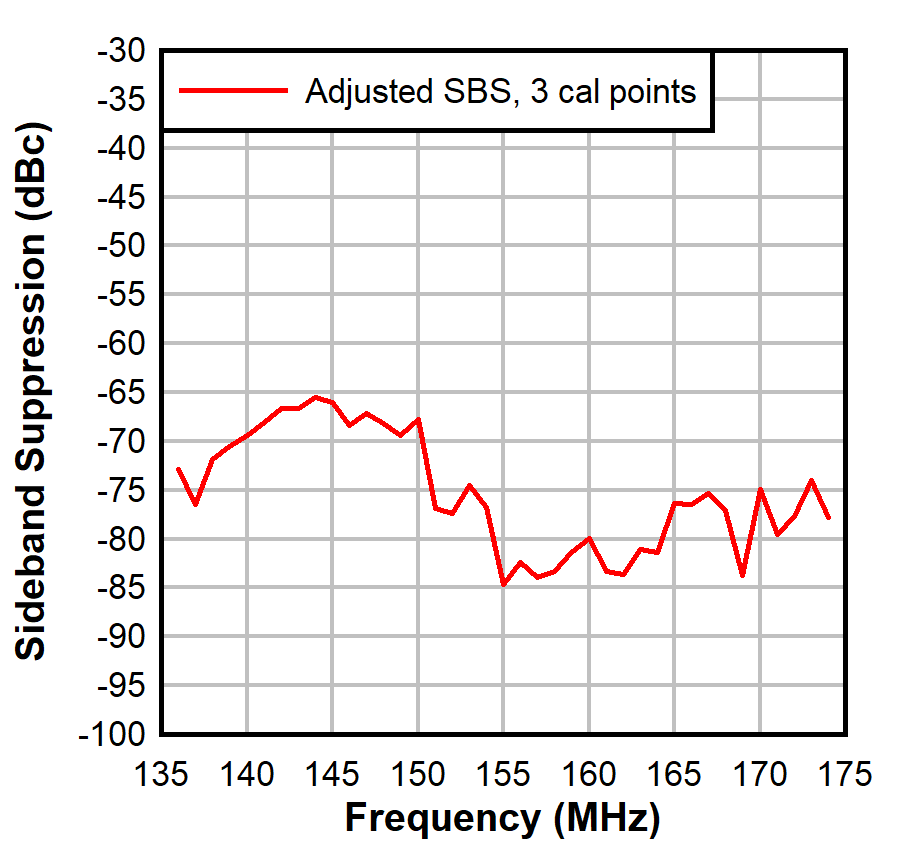 Figure 2-6 Adjusted SBS vs
Frequency