SSZTA72 may 2017 ADS1292 , ADS1294 , ADS1299 , ADS1299-4 , MSP430FR5994
In the fourth installment of this six-part smart sensing series, I would like to discuss the operating principle and implementation of the Holter monitor.
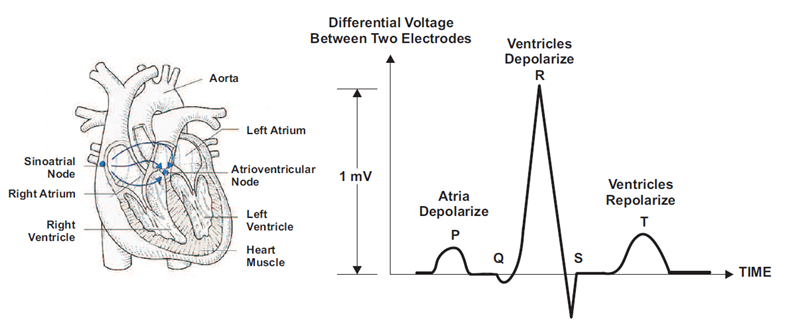
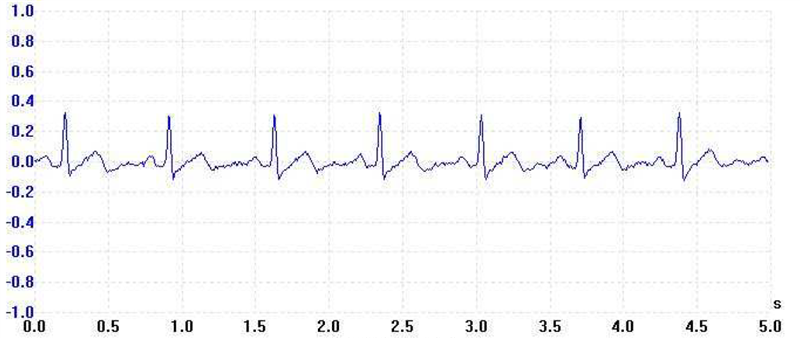
An electrocardiogram (ECG) graphically records the electrical activity of the heart and recognized biological signals used for clinical diagnosis. An ECG sensor detects small changes in the electrical activity upon every heartbeat over a period of time. The ECG measurement provides valuable insights into the functionality of the heart based on the regularity of the heartbeats. Figure 1 shows the anatomy of the human heart and the heartbeat waveform of an ECG signal. Figure 2 shows an ECG waveform over a time interval of 5s.
 Figure 1 Heart Anatomy and ECG Pulse
for a Heartbeat
 Figure 2 ECG Waveform over 5s
A Holter monitor is a portable ECG recording device for a patient to wear. It continuously monitors a patient’s cardiovascular activity over an extended period of time (at least 24 hours) for symptoms that a physician cannot diagnose in a short office visit. Invented by Holter Research Laboratory in the 1950s, a Holter monitor was initially designed to observe variations in the normal cardiac rhythm during everyday activities. In recent years, its use has been further extended into detecting pacemaker malfunctions, heart-rate variability studies and the diagnosis of abnormal cardiac symptoms. Patients can wear Holter monitors as wearable sensors for remote monitoring.
When the recording of an ECG signal is finished (usually after 24 or 48 hours), the physician performs signal analysis. Since it would be extremely time-consuming to browse through such a long signal, there is an integrated automatic analysis process in the software of each Holter device that automatically determines different sorts of heartbeats, rhythms, etc. The success of automatic analysis is very closely associated with signal quality; the quality itself depends on the attachment of the electrodes to the patient’s body. If the electrodes are not properly attached, electromagnetic disturbance can influence the ECG signal and result in a very noisy record. If the patient moves rapidly, the distortion will be even greater, making the signal very difficult to process. Besides the attachment and quality of electrodes, other factors affecting signal quality include muscle tremors, sampling rate and resolution of the digitized signal. High-quality devices offer a higher sampling frequency to capture more information in the data.
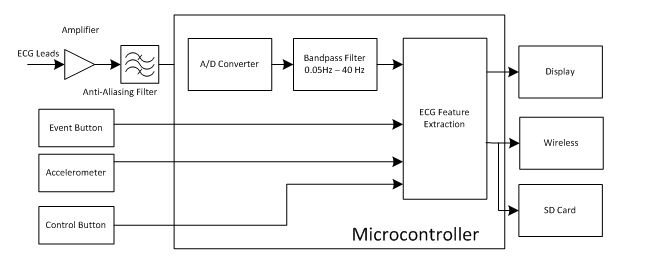
Figure 3 shows a simplified functional block diagram of a Holter monitor. Since the amplitude of the electrocardiographic signal is only about a couple of millivolts, a special low-noise amplifier is required to boost and filter the signal for proper sampling by an analog-to-digital converter (ADC). The sample frequency for each channel can be up to 1000Hz to capture details for diagnostic purposes. An accelerometer helps associate the patient’s body movements to the recorded ECG data.
 Figure 3 Simplified Functional Block
Diagram of a Holter Monitor
Figure 3 Simplified Functional Block
Diagram of a Holter MonitorA Holter monitor needs to perform two basic tasks. The first task is to record ECG data with good quality for clinical interpretations. The ECG signal voltage level is as low as 0.5 to 5mV, and susceptible to artifacts that are larger than it is. It is very important to filter out noise to ensure correct clinical interpretation.
A strong source noise that interferes with the ECG signal is the capacitive interference of the human body. This interference voltage could be as high as 2.4V, which is much higher than the ECG signal’s value range (0.02mV to 5mV). There are also electromagnetic interferences inducing extra voltages on the electrodes. For these reasons, the front-end amplifier needs to be low noise and work in differential mode with a high common-mode rejection ratio (CMRR).
Two additional types of noise sources corrupt the signal quality. The first type is called baseline wander. It is an extra-low frequency and caused by respiration and body movements. Baseline wander can cause problems with analysis, especially when examining the low-frequency S-T segment in Figure 1. The second type is interference from power lines, either at 50 or 60Hz. Monitoring normal cardiac rhythms during everyday activities typically requires a bandwidth of 1-40Hz. A bandpass filter would effectively reduce those noises.
There could be an additional requirement on the ECG data when attempting to diagnose less-common symptoms. To minimize the filter effect on the S-T wave, the low-end frequency of the bandpass filter has to go to 0.1Hz. Diagnosing other symptoms requires frequency components of up to 150Hz. The sample rate and parameters of a Holter monitor noise filter have to be adjustable in order to make sure that the recorded data contains the required information. When the bandpass filter window includes noise, more advanced noise filtering and cancellation will be needed in offline processing. It is important to preserve the magnitude and phase of the ECG during filtering and transform operations.
The second task is to extract basic clinical features in order to assist with offline clinical analysis and notify physicians when the patient feels something abnormal. The most common features include information about heart rate, heart-rate variability (maximum, minimum and standard deviation), rhythm overview and patient diary (which records moments when the patient pressed the event button). Heartbeat information is derived from R-R interval measurements including R-R interval mean, standard deviation and value of the differences between successive R-R intervals. Another requirement is pacemaker detection and analysis, which is useful when checking for correct pacemaker function.
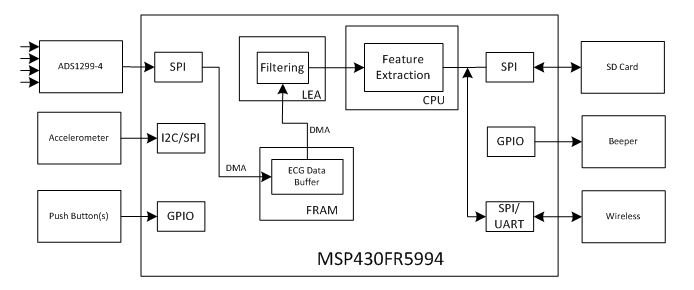
Since a Holter monitor is a wearable device operating in an extended period of time (some existing products can operate for as long as 96 hours on an AA battery), low power consumption is a major design goal. Figure 4 illustrates a functional block diagram of a Holter monitor implementation. It is based on TI’s ADS1299 ADC and ultra-low-power MSP430FR5994 microcontroller.
 Figure 4 Functional Block Diagram of a
Holter Monitor Based on TI’s MSP430FR5994 MCU
Figure 4 Functional Block Diagram of a
Holter Monitor Based on TI’s MSP430FR5994 MCUIn the block diagram, ADS1294 is a four-channel, low-noise, 24-bit, simultaneous-sampling delta-sigma (ΔΣ) ADC with a built-in programmable gain amplifier (PGA), internal reference and on-board oscillator. It incorporates all commonly required features for ECG applications. The ADS1294 supports a CMRR of -110dB and operates at data rates from 250SPS to 16kSPS. You can implement lead-off detection internal to the device using an excitation current sink or source. With its high levels of integration and performance, the ADS1294 enables the creation of scalable medical instrumentation systems at significantly reduced size, power and overall cost. In the case that only two input channels are needed, ADS1294 can be replaced by ADS1292 as a lower cost solution.
ECG data passes to the MSP430FR5994 MCU through a Serial Peripheral Interface (SPI) port. To improve processing efficiency, the MSP430FR5994 direct memory access (DMA) saves the SPI data for multiple ECG channels to a data buffer in the on-chip ferroelectric random access memory (FRAM). After accumulating a block of data (over a period of 1s, for example), the central processing unit (CPU) will arrange the data from a specific channel to a buffer in the low energy accelerator (LEA) RAM for filtering and other processing. There are 256KB of FRAM on the MSP430FR5994 – plenty of space to store the data and program. The FRAM’s fast write and read speeds make it a good fit not only in data logging but also as a slow speed RAM for storing less frequently used data.
Since Holter monitor is a wearable device, power consumption is major design concern. The MSP430FR5994 MCU integrates the LEA module to speed up vector math operations such as finite impulse response (FIR) filtering with ultra-low power consumption. The LEA module takes less than 0.1s to apply a 256-tap FIR filter on a block of 1,024 data points when running at 16MHz. It only consumes 67µA/MHz. Assuming four ECG channels, it would take the LEA module about 0.4s to filter the data collected over 1s at a sample rate of 1Ksps per channel. The LEA module only consumes about 0.4mA on average for such operation.
What do you think about the above discussion? I would like to see your opinions so that we can better serve you in your design work.
Additional Resources
- If you’re interested in the many published algorithms for searching the R-peak in ECG data, download the application report, “EKG-Based Heart-Rate Monitor Implementation on the LaunchPad Using MPS430G2xx.” The LEA module supports maximum and minimum finding functions that could reduce the cycles in finding R-peaks.
- Learn more about Holter monitors in the Journal of NeuroEngineering and Rehabilitation article, “A review of wearable sensors and systems with application in rehabilitation.”
- Learn more about ECG data processing and analysis:
- Read Chapter 3 of “Advanced Methods and Tools for ECG Data Analysis, “ECG Statistics, Noise, Artifacts, and Missing Data.”
- Download the International Journal of Computer Applications article, “Time and Frequency Exploration of ECG Signal.”
- Learn more about the ADS1294 ADC family.