SSZT715 May 2018 CC3120
Motors and pumps are key infrastructure components in both factories and buildings and must be maintained in proper working condition in order to perform their tasks. These tasks may range from moving objects on an automation line to transporting cooling fluids/air for heating, ventilation and air-conditioning (HVAC) systems.
At any time, a drop in performance may result in costly maintenance or downtime for your production capability. To maintain satisfactory performance, it is vital to monitor these machines for indicators of potential failures, some of which may not be observed by human senses but by low-power and smart sensor solutions deployed as part of a production infrastructure.
Vibration Analysis for Motors
Humans can listen for the condition of a moving element when the system is close to a breakdown. However, the same element may not produce an audible noise, or perhaps the noise is not easily detectable because of the environment it’s in, like a noisy factory floor or motor housing. The Figure below shows the construction of a motor bearing.
 Figure 1 Internal View of a Motor Bearing
The mechanical construction of a motor bearing comprises:
- The inner race – the inner surface of the moving element, which is typically mounted on the shaft.
- The outer race – the outer surface of the moving element; this is a static component.
- The cage – holds the ball bearings in place.
- Rolling element “balls” – the moving elements between the inner and outer races.
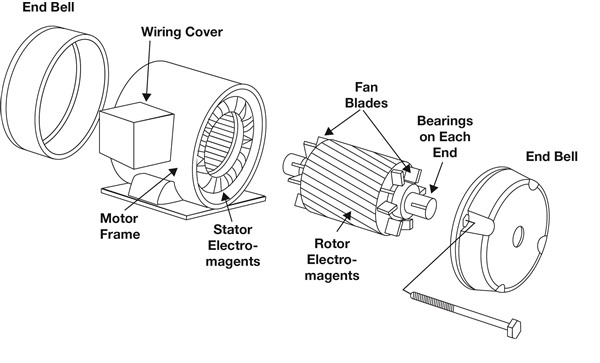
The elements of a motor outside of its housing may consist of a shaft, gears and/or mounting posts.
The onset of a fault will result in small mechanical deformities. When the moving elements of a motor make contact with these deformities, as a result of repeated and consistent impact between two surfaces, the faults manifest themselves as shock pulses.
Fortunately, each of these shock pulses has a relation to the rotational speed of the motor, expressed using rotations per minute (RPM). This means that any onset of a mechanical fault can be expressed as an equation. For example, the ball bearings moving over a fault on the inner race produces a defect frequency called the ball pass frequency of inner race (BPFI), which is different from the defect frequency generated when the ball bearings move over a fault on the outer race, which is called the ball pass frequency of outer race (BPFO).
You can calculate BPFI and BFPO using Equations 1 and 2, respectively:
Where NB is the number of balls, S is the revolutions per second (RPM ÷ 60), BD is the ball diameter, PD is the pitch diameter and θ is the contact angle of the ball to the race.
The parameters provided by NTN Bearing Corporation for deep groove ball bearings with the bearing number 16001, result in a BPFI of 4.93 and a BPFO of 3.07 for the S value. Thus, for a 3,600 RPM motor or S = 60Hz, the BPFI is 295.8Hz and the BPFO is 184.2Hz.
Knowing these frequency values is great, but how do you detect a potential motor failure? The answer lies in the shock pulse itself. Using a multiaxis microelectromechanical (MEMS) accelerometer, you can detect shock pulses, translate the vibration into an electrical signal and then intelligently process the signal.
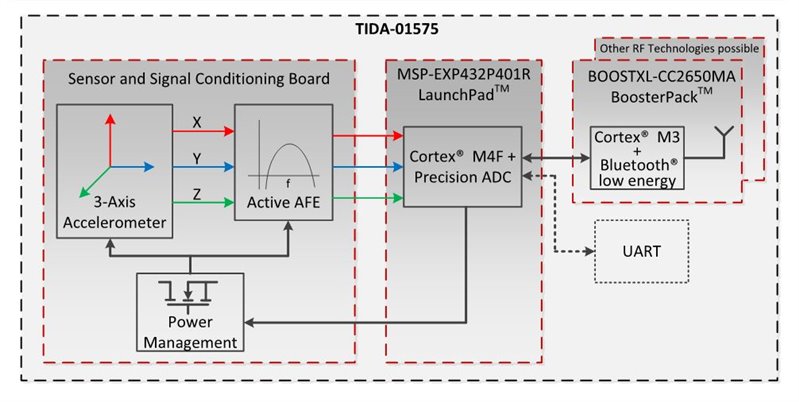
The Reference Design for Wireless Condition Monitor for Motors and Pumps Using Multi-Axis Vibration is an example of such a vibration sensor (see Figure 2). It uses an analog three-axis accelerometer that is measured by the precision analog-to-digital converter (ADC) of the SimpleLink™ MSP432P4 host microcontroller (MCU). The sensor node processes the measured data by generating a fast Fourier transform (FFT) of it.
 Figure 2 Wireless Condition Monitor Reference Design Block Diagram
An analysis of the resulting frequency domain data, which can detect these frequency values, can be transmitted wirelessly via Bluetooth® low energy to a gateway, smartphone or tablet. On-site operators can use the data from the sensor directly for diagnostics and troubleshooting. In the cloud, you can store the data and perform further analysis based on previously captured historical data. Depending on the system requirement, additional wireless protocols like Zigbee, 6LoWPAN and wireless mesh are also possible for transmitting the data.
Similarly, every component of the motor assembly produces a different defect frequency or pattern. Being able to nonintrusively monitor a motor and know what frequencies relative to the RPM of the motor to look for enables operators to detect failures proactively.
Conclusion
The ability to isolate and identify frequency patterns for motors and pumps in automated environments ranging from factories to homes helps provide early indication of failure for motors and pumps, resulting in cost and time savings for operators and users. With intelligence and wireless connectivity at the edge node and learning algorithms on the cloud, it’s possible to integrate an automation infrastructure in an ever-increasingly connected world.
Additional Resources
- To get up to speed on the integrated precision ADC of the MSP432P4 host MCU, see these application reports and blog posts:
- Blog: Predicting failure with Condition Monitoring
- To help you develop wireless connectivity solutions and understand predictive maintenance download the following resources:
- Video on Vibration Condition Monitoring with SimpleLink MSP432P4 precision ADC MCU
- To help you develop wireless connectivity solutions for the MSP432P4 host MCU, see the examples in:
- SimpleLink MSP432P4 software development kit (SDK).
- Bluetooth plug-in for the SimpleLink MCU SDK.