Debugging Sitara AM2x Microcontrollers
Abstract
This application note covers the various debugging tools and techniques available to users developing applications with Sitara™ AM2x microcontrollers (MCUs).
Trademarks
Sitara™ and Code Composer Studio™ are trademarks of Texas Instruments.
Arm® is a registered trademark of tm.
Cortex® is a registered trademark of Arm Limited (or its subsidiaries) in the US and/or elsewhere.
All trademarks are the property of their respective owners.
1 Building for Debug
This section covers how to build your application for optimal debugging.
1.1 Disable Code Optimization
Before debugging your code, disable any compiler optimization. When compiler optimization is enabled, stepping through code can become unpredictable, and breakpoints sometimes cannot be set to the exact line in the C source code. This is because the optimizer can condense code and impact the correlation between the assembly instruction and the C source. Due to this, the recommendation is to turn off compiler optimization when stepping through code.
To disable compiler optimization, go to your project's properties > Build > Arm Compiler > Optimization, and set the optimization level to none or 0. If building with makefiles, this can be done by modifying the makefiles directly. For MCU+ SDK, this is typically done within the submodule's makefile (not the top-level makefile).
1.2 Using the Debug SDK Libraries
The SDK provides two versions of libs: "Debug" and "Release". The "Debug" version is built with optimization disabled, while the "Release" version is built with optimization enabled. The recommendation is to use the "Debug" version of an SDK lib when debugging.
The SDK libs follow the naming convention: "{library name}.{device}.{core}.{compiler}.{version}.lib"
For example, "drivers.am243x.m4f.ti-arm-clang.release.lib" implies the following:
- Library Name: Drivers Library
- Device: AM243x MCU
- Core: Arm® Cortex®-M4F Core
- Compiler: TI Arm Clang Compiler
- Version: Release
The libraries that are linked to your project can be configured in the project properties under Build > Arm Linker > File Search Path.
2 Code Composer Studio Stop-Mode Debugging
This section covers the key debug features offered by Code Composer Studio™ (CCS) for stop-mode debugging. Stop-mode debugging refers to debugging where stopping or halting the core is involved, as opposed to real-time debugging, which involves debugging without stopping the core (real-time debug is discussed in this application note in a later section).
2.1 Configuring the Debugger
The chip can be debugged using CCS via the JTAG port. If using a Sitara AM2x MCU evaluation board, you can use the on-board JTAG debug probe. There is also typically support for using your own JTAG debug probe via an external header.
To setup your board and debugger for CCS debug, see the EVM Setup section of the MCU+ SDK Getting Started guide for your device to setup your board and debugger for CCS debug.
2.2 Breakpoints and Watchpoints
This section covers breakpoints and watchpoints and how to use them.
Breakpoints are program locations where the processor must halt so that debugging can occur. Both hardware and software break points allow the core to halt at a given PC location.
Watchpoints are breakpoints that can be triggered to halt program execution when a particular memory read or write occurs. Watchpoints are extremely useful to catch exceptions, invalid memory boundary accesses, overrun buffers, and so forth and can be set to access any memory region, including Memory Mapped Registers (MMRs).
2.2.1 Software Breakpoints
A Software breakpoint is implemented as an opcode replacement. The debugger modifies the opcode by inserting an estop_0 instruction where the previous instruction was. The program counter stops immediately before it executes the software breakpoint instruction. In general, this instruction is hidden from the main interface, but in certain instances this instruction is displayed in the Disassembly View. Software breakpoints can only be set in memory regions with write access (RAM), therefore, there is no theoretical limit to the number of software breakpoints that can be used.
To toggle a breakpoint, either double-click on the left side of either the line number in the source code view or the address in the disassembly view, or right-click → Toggle Breakpoint.
CCS allows you to single-step through the code in your program. With the breakpoint set, select Run > Step Into to step into a given function.
You can also select Run > Step Over that executes the function in a single step. This is useful when you do not want to enter a certain function when single-stepping through code.
2.2.2 Hardware Breakpoints
A Hardware breakpoint is implemented internally by the target hardware. The method used to do this is heavily dependent on the device or core, but typically the debugger writes the address to a register on the device and sets a flag to enable breakpoints. These registers are not exposed to the IDE. A hardware breakpoint can be set in any memory type (RAM, Flash or ROM), but it is limited by the number of registers on the device. This is mandatory for the types of console I/O devices. Hardware breakpoints can also have a count, which determines the number of times a location is encountered before a breakpoint is generated. For example, if the count is 2, a breakpoint is generated every second time. Hardware breakpoints make use of dedicated registers and hence are limited in number. The AM243x supports 8 hardware breakpoints and 8 watchpoints. To see how many hardware breakpoints and watchpoints are supported per device family, see the device-specific technical reference manual.
2.2.3 Watchpoints
Watchpoints are a special category of hardware breakpoints that can be triggered for a particular memory read or write. Watchpoints are extremely useful to catch exceptions, invalid memory boundary accesses, overrun buffers, and so forth and can be set to access any memory region, including Memory Mapped Registers (MMRs).
To set a Watchpoint, highlight a variable in the source code editor, right click and select Breakpoint → Hardware Watchpoint. For example, right click on the variable gGpioIntrDone and add a watchpoint. Whenever you press the general-purpose input/output (GPIO) push button, a breakpoint will trigger when gGpioIntrDone increments at the line gGpioIntrDone++; in GPIO_bankIsrFxn().
A common issue causing software instability is stack overflow. When building a project, the stack size is typically specified in the project linker, that corresponding size is allocated for the stack by the linker. A hardware watchpoint can be set to monitor when the location __STACK_END - 2 is written to, which indicates that a stack overflow has occurred.
2.3 Inspecting Device Registers
To open the Registers view: View → Registers.
The Registers view allows for viewing and editing the contents of core and peripheral registers of the device, including bitfields and individual bits.
Type Ctrl+F or right click → Find to search for any register in the register window.
2.4 Inspecting Disassembly
This section covers how to use the CCS Disassembly view to get further insight into your running software.
The CPU opcodes of the software executing on the target can be viewed in the Disassembly window (View → Disassembly) of the core. Assembly step into and step over buttons in the debug window can be used to step through the disassembly.
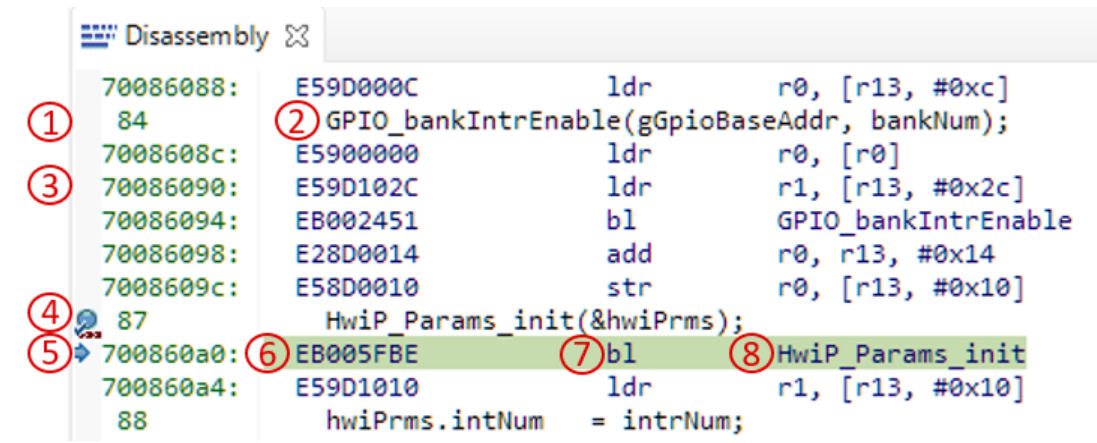
The Disassembly view contains several points of information:
- Line numbers of the source file in context
- C source code at the line number
- Program addresses
- Breakpoint indicators
- Program Counter - the next instruction to be executed
- Opcodes in hex format
- Disassembled instructions
- If the opcode references a function or variable, their names are also shown
3 Debug Logging
This section covers the various options supported for debug (printf-style) logging.
3.1 Logging Methods
The Driver Porting Layer (DPL) of the SDK contains a Debug Log module that provides APIs for debug logging and is the recommended method for providing "printf" style logging. These options can be configured in the SysConfig GUI under TI Driver Porting Layer (DPL) → Debug Log.
There are 3 logging methods supported by the Debug Log module:
- CCS Console Logging (via JTAG) – To enable logging to the CCS Console, check "Enable CCS Log" in the SysConfig window. To open the console in CCS, click View → Console.
- UART Logging - To enable UART logging, check "Enable UART Log." This automatically adds a universal asynchronous receiver/transmitter (UART) driver instance to be used with the logger.
To view the UART Log output, open the CCS Terminal by going to View → Terminal. In the Terminal window, click "Open a Terminal" and configure the Terminal based on the UART settings in SysConfig.
The default UART terminal settings are:
| Parameter | Value |
|---|---|
| Baud Rate | 115200 |
| Data Length | 8-bit |
| Parity Type | None |
| Stop Bit | 1-bit |
| Flow Control | None |
- Shared Memory Logging -
The Shared Memory Logger allows you to share and output logs with other cores in
the device.
- Shared Memory Log Writer - Logs the debug output to shared memory. Another core should have the Shared Memory Log Reader enabled to read the debug log strings.
- Shared Memory Log Reader (FreeRTOS only) - Reads the string logged by another core and outputs it to the logs selected on the core. This needs task support so the reader core needs to be running FreeRTOS
A core can only be designed as a reader or writer, not both. When a core has the Shared Memory Log Reader enabled, the option to use the Shared Memory Writer is ignored. When the Shared Memory Logger is enabled, SysConfig generates the shared memory section to be used for logging in ti_dpl_config.c.
`DebugP_ShmLog gDebugShmLog[CSL_CORE_ID_MAX] __attribute__((aligned(128), section(".bss.log_shared_mem")));`This section .bss.log_shared_mem from the above code snippet needs to be reserved for shared memory logging and needs to be allocated at the same shared memory address location for all cores. This section is reserved in the linker command file. This section also needs to be marked as non-cache in the MPU/MMU module within SysConfig.
3.2 Log Zones
The Debug Log module has support for "Log Zones", which allows for enabling and disabling different types of debug log messages. These Log Zones are used in the SDK drivers but can also be used in the application. The following Log Zones are supported:
- Error Log Zone
- Warning Log Zone
- Info Log Zone
Having the debug log messages separated into different zones provides the ability to easily change the verbosity of the drivers.
3.3 Asserts
The Debug Log module allows for assert testing, If a given expression is evaluated to 0, the application disables the interrupts and loop forever. The application also logs the file name and line number where the assert occurred.
3.4 Example Usage
Include the below file to access the APIs:
#include <stdio.h>
#include <kernel/dpl/DebugP.h>
Example usage for assert:
void *addr = NULL
/* This will assert when address is NULL */
DebugP_assert(addr!=NULL);Uint32_t value = 10;
char *str = "Sitara AM2x debugging";
/* Use snprintf to format the string and then call logging function */
DebugP_log("This is %s and value is = %d", str, value);DebugP_log("Enter a 32b number \r \n");
value32 = 0;
DebugP_scanf("%d", &value32);
DebugP_log("32b value = %d\r\n", value32);4 Multi-Core Debug
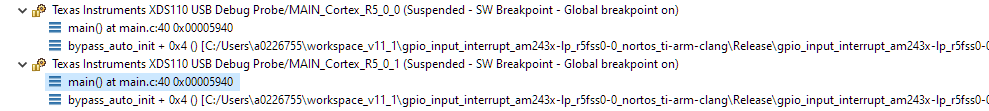
The Debug view displays the stack frames for each debuggable core on a multi-core target. Most of the various views in the Debug perspective (Register, Variables, Disassembly, Memory Browser, and so forth) reflect the context of the highlighted stack frame for the specified core.
4.1 Grouping Cores
Commands can be sent to a specific set of cores at the same time. This can be done by "grouping" the cores of interest in the Debug view.
4.1.1 Fixed Group
Once a debug session is started, you can create a more permanent group. This Fixed Group has a specific node in the Debug view that has its own debug context. Selecting this group debug context causes debug commands to be sent to all group members without the need to select them individually. Note, that while the commands are sent simultaneously, how synchronously the commands are executed depends on if the hardware target itself supports synchronous execution.
In the screenshot below, a Fixed Group is created for just the first and second CPUs in the Debug view by multi-selecting them and then using the Group core(s) option:
This causes a new group called Group 1 to appear in the Debug view, with the CPUs members.
4.1.2 Hiding Cores
It is possible to filter the list of CPUs visible in the Debug view that will not be used. This helps to avoid clutter in the view to avoid accidentally selecting a debug context of a CPU that is not to be used. To hide CPUs:
- Multi-select the CPUs to hide, right-click and select Hide core(s) in the context menu.
- Selected CPUs will disappear from the view,
- Unhide all CPUs with Show all cores option,
Note that you can set this filter before starting a debug session by specifying which CPUs to display in the Debug Configuration
4.2 Using Multiple Workbench Windows
Multiple main windows (called Wordbench windows) can be treated to have each window dedicated to a specified core during the debug session. A new window can be created using the Window → New Window option. A Workbench window has its own debug context (Workbench window 1 can show data for core 1 while Workbench window 2 shows data for core 2, and so forth). Note that creating a new window does not mean a new debug session. Each window is associated with the same debug session but can be specified, using the Debug view, to reflect the context of a different core.
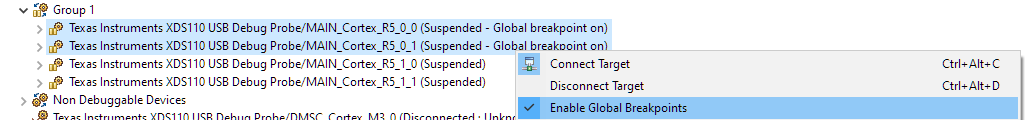
4.3 Global Breakpoints
Each debug context can be configured for Global Breakpoints. This feature essentially makes breakpoints global across all debug contexts that have it enabled. For example, if the debug contexts for CPU 1 and 3 have global breakpoints enabled, and CPU 1 hits a breakpoint, CPU 3 will also be halted (if it was running). And vice versa.
The screenshot below shows an example of enabling global breakpoints for the whole group. This enables global breakpoints for each CPU in the group:
5 Debugging Arm Cortex-R5 Exceptions
This section covers the various exceptions that can occur on the Arm Cortex-R5 core and the techniques to debug them.
An “Exception” is an event that makes the processor temporarily halt the normal flow of program execution, for example, to service an interrupt from a peripheral. Before attempting to handle an exception, the processor preserves the critical parts of the current processor state so that the original program can resume when the handler routine has finished. In practical situations, exceptions can be mainly categorized into the following:
- Interrupts (Normal Interrupts IRQs and Fast Interrupts FIQs/NMIs)
- Aborts (Data Abort, Prefetch Abort)
- Undefined Instruction (UNDEF) exceptions
5.1 Exception Priority Order
When several exceptions occur simultaneously, they are serviced in a fixed order of priority. Each exception is handled in turn before execution of the user program continues. It is not possible for all exceptions to occur concurrently. For example, the Undefined Instruction and SVC exceptions are mutually exclusive because they are both triggered by executing an instruction. Because the Data Abort exception has a higher priority than the FIQ exception, the Data Abort is actually registered before the FIQ is handled. The Data Abort handler is entered, but control is then passed immediately to the FIQ handler. When the FIQ has been handled, control returns to the Data Abort handler. This means that the data transfer error does not escape detection as it would if the FIQ were handled first.
| Exception | Priority |
|---|---|
| Reset | 1 (Highest) |
| Data Abort | 2 |
| FIQ | 3 |
| IRQ | 4 |
| Prefetch Abort | 5 |
| SVC | 6 |
| Undefined Abort | 6 (lowest) |
5.2 Aborts
When an abort happens, the program gets halted at the Exception Vector Table in address 0xFFFF00##:
| Value of V bit | Exception vector base location |
|---|---|
| 0 | 0x00000000 |
| 1 (HIVECS) | 0xFFFF0000 |
The last two nibbles in the address (0xFFFF00##) indicates the type of abort as shown.
| Exception | Offset From Vector Base |
|---|---|
| Reset | 0x00 |
| Undefined Instruction | 0x04 |
| Software Interrupt | 0x08 |
| Abort (prefetch) | 0x0C |
| Abort (data) | 0x10 |
| IRQ | 0x18 |
| FIQ | 0x1C |
All exceptions end up in the address specified in the Exception Vector Table. The program execution can then branch to application-specific handlers. The branch target address differs based on the application. Two such examples are discussed below:
- An application can use the default exception handlers designed as a “trap” where the execution gets stuck. Below is an example to a prefetch abort handler (an infinte loop):
Void __attribute__((interrupt("ABORT"), section(".text.hwi"))) HWiP_prefetch_abort_handler(void)
{
   volatile uint32_t loop = 1;
   while(loop)
      ;
}- An implementation can have advanced exception handling capabilities in the OS, where the details of the exception will be read and a corresponding error code are notified by the custom OS error handler. In such cases, details of the error codes can be checked to understand the actual exception that was triggered. R13, R14, and SPSR registers of the corresponding exception can be read for debugging the issue.
There are three important Arm Cortex-R5 registers that can also be used to confirm the current state of the processor.
CPSR:
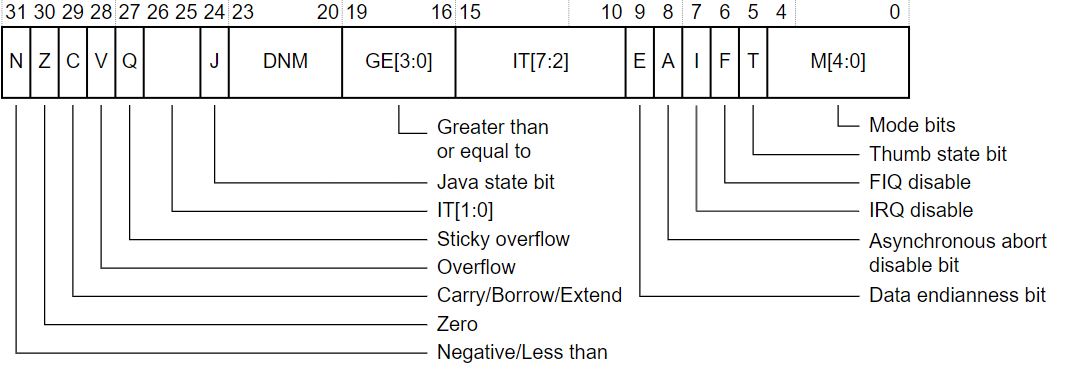
The CPSR can be used to verify the current mode of the processor. The mode bits of the CPSR register can be used to check if the current mode is Abort:
| M[4:0] | Mode |
|---|---|
| 10000 | User |
| 10001 | FIQ |
| 10010 | IRQ |
| 10011 | Supervisor |
| 10111 | Abort |
| 11011 | Undefined |
| 11111 | System |
SPSR:
The SPSR can be used to check the previous mode just before entering the exception. For example, if the processor moves from System to Abort Mode, SPSR shows the mode as “System” while CPSR shows the mode as “Abort”. The bit definitions of SPSR register are the same as that of the CPSR register.
R14 Register (Link Register):
The R14 register is used to find the actual instruction or function call that caused the synchronous abort. The actual address of the instruction that triggered the Exception is R14 - x, where “x” depends on the type of exception.
Aborts are usually unintended exceptions resulting due to invalid or unsuccessful access of memory. Some of the causes for aborts are as follows.
- Permission fault indicated by the Memory Protection Unit (MPU)
- Error detected in the data by the ECC checking logic
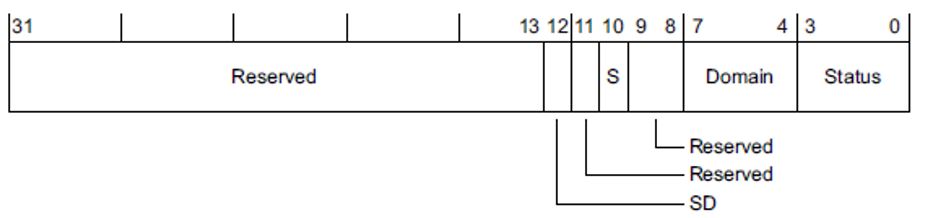
If the exception is confirmed to be a Data Abort, as the first step check the value of the Data Fault Status Register (DFSR) of the Cortex-R CPU. The DFSR holds status information about the last data fault.
Figure 5-1 shows the DFSR register bit assignments.
 Figure 5-1 DFSR bits
Use the “S” Bit [10] and “Status Bits” [0:3] to understand the nature of the Data Abort. For status description, see Table 5-1.
| Priority | Sources | FSR[10,3:0] | FAR |
|---|---|---|---|
| Highest | Alignment | 0b00001 | Valid |
| Background | 0b00000 | Valid | |
| Permission | 0b01101 | Valid | |
| Synchronous external abort | 0b01000 | Valid | |
| Asynchronous external abort | 0b10110 | Unpredictable | |
| Synchronous parity or ECC error | 0b11001 | Valid | |
| Asynchronous parity or ECC error | 0b11000 | Unpredictable | |
| Debug event | 0b00010 | Unpredictable |
SD Bit:
The SD Bit distinguishes between an AXI Decode or Slave error on an external abort. This bit is valid only for external aborts. For all other types of abort, this bit is set to zero.
- 0 = AXI Decode error (DECERR) or AHB error caused the abort, generated, typically by an interconnect component, to indicate that there is no slave at the transaction address (The address you requested is not valid)
- 1 = AXI Slave error (SLVERR) or unsupported exclusive access caused the abort. Used when the access has reached the slave successfully, but the slave wishes to return an error condition to the originating master an error condition to the originating master. (Valid address, but slave is unable to do the requested operation)
RW Bit:
The RW bit indicates whether a read or write access caused the abort.
- 0 = read access caused the abort
- 1 = write access caused the abort
5.2.1 Data Aborts
5.2.1.1 Alignment
This indicates that the memory access does not follow alignment requirements, which differ according to the memory attribute of the region:
- “Normal” supports unaligned support (this is configurable)
- “Device” / “Strongly Ordered” supports only aligned access
This means that if a region is configured as “Strongly Ordered” and you try to do an Un-Aligned Memory access, an Alignment Data Abort occurs. The Memory Map of the Cortex R5 has address range 0xEFFFFFFF to 0xFFFFFFFF configured as “Strongly Ordered” by default.
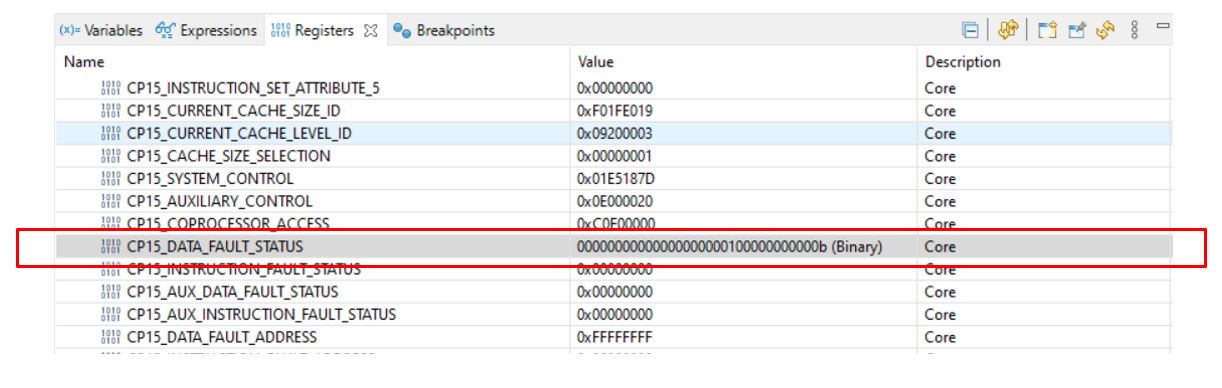
5.2.1.2 Background Aborts
Memory Protection Unit (MPU) settings must be correct for any region that the CPU is going to access. If the address that the CPU issues falls outside any of the defined regions and the MPU is enabled, the MPU is hard-wired to abort the access. That is, all accesses for an address that is not mapped to a region in the MPU generate a background fault. A background fault does not occur if the background region is enabled and the access is Privileged. An MPU background fault might indicate a stack overflow, and be rectified by allocating more stack.
In the example below, in line 55, an address that falls outside any of the defined regions is trying to be written to.
Example:
void empty_main(void *args)
{
   Drivers_open();
   Board_driversOpen();
   *((volatile uint32_t*) 0xFFFFFFFFF = 0x12;

   Board_driversClose();
   Drivers_close();
}
By checking the DATA_FAULT_STATUS register (DFSR), bits [10, 3:0], you can see that it fits to Background Abort.
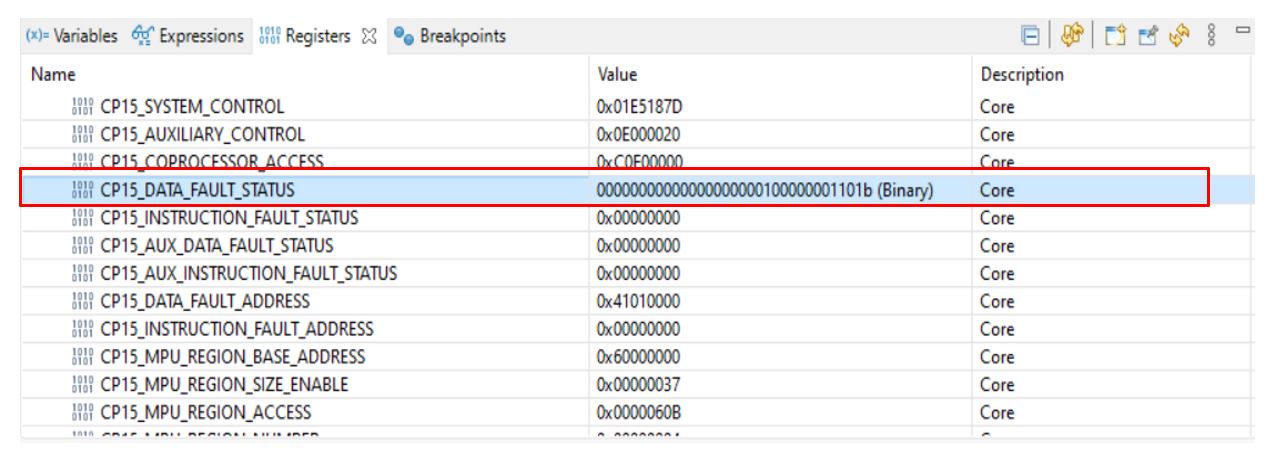
5.2.1.3 Permission
This can happen when MPU settings prevent the access of a region. For example, if a User mode application attempts to access a Privileged mode access only region a permission fault occurs.
Example:
__attribute__((section("mySection"))) Bool test;

void empty_main(void *args)
{
   Drivers_open();
   Board_driversOpen();
   test = 1;

   Board_driversClose();
   Drivers_close();
}
A read-only memory section was created by configuring the MPU access permission attributes. Then, a Boolean variable test is placed in this read-only section (line 48). When trying to write to this variable (line 56), an MPU permission fault was triggered.
5.2.1.4 Synchronous/Asynchronous External
This happens when the access has been transferred from the CPU to the AXI/AHB Bus and encountered an error. This is the most common fault type that happens with Data Abort. If the Abort is Synchronous, you can check the actual memory address that when accessed resulted in Data Abort using Data Fault Address Register (DFAR), which holds the address of the fault when a synchronous abort occurred.
5.2.1.5 Synchronous/Asynchronous ECC
This happens if an ECC error is detected at TCM interfaces or in the cache.
5.2.2 Synchronous/Asynchronous Aborts
5.2.2.1 Changing an Asynchronous Abort to a Synchronous Abort
If store instructions to peripheral areas cause the exceptions, you can configure the corresponding peripheral area as “Strongly-Ordered” via the Arm MPU (using SysConfig). A write to “Strongly-Ordered Memory” can complete only when it reaches the peripheral or memory component accessed by the write. However, this may impact the performance because a “Strongly Ordered” MPU attribute waits for the access to be completed before processing the next data access.
5.2.2.2 Synchronous Abort
Also known as a precise abort, is one for which the exception is ensured to be taken on the instruction that generated the aborting memory access. The abort handler can use the value in the Link Register (R14) to determine which instruction generated the abort, and the value in the Saved Program Status Register (SPSR) to determine the state of the processor when the abort occurred. This happens when the access has been transferred from the CPU to the AXI/AHB Bus and encountered an error. This is the most common fault type that happens with Data Abort. If the Abort is Synchronous, you can check the actual memory address that when accessed resulted in Data Abort using Data Fault Address Register (DFAR), which holds the address of the fault when a synchronous abort occurred.
5.2.2.3 Asynchronous Abort
Also known as an imprecise abort, is one for which the exception is taken on a later instruction than the instruction that generated the aborting memory access. Asynchronous faults are comparatively difficult to analyze because you cannot trace the exact location that resulted in the abort unlike the DFAR register that is used in Synchronous Faults. In general, “store” instructions (STB, STH, STR, STM/PUSH) to areas with “Normal” or “Device” memory attributes causing an error are asynchronous.
5.2.2.4 Debugging Asynchronous Abort
From the DFSR Register, you can check status bits, SD bit, and RW bit.
As mentioned above, SD indicated whether it is an internal AXI decode error or external AXI slave error, and RW indicates whether a read or write access caused an abort.
After the relevant information was extracted from the DFSR, the information can track the instruction that causes the abort:
- R14 – 8 is a location near the instruction that caused the exception
- Find a “store” instruction near R14 – 8, which can likely cause the exception
5.2.3 Prefetch Abort
Prefetch Abort (PABT) Exception occurs when an instruction fetch causes an error. When a Prefetch Abort occurs, the processor marks the prefetched instruction as invalid, but does not take the exception until the instruction is to be executed. If the instruction is not executed, for example because a branch occurs while it is in the pipeline, an abort does not occur. All prefetch aborts are synchronous. The difference between Undefined Instruction Abort and Prefetch Abort exception is that in case of prefetch, CPU is unable to fetch the instruction from the address; in an Undefined Instruction Exception, the CPU does not know what the instruction does.
The reason for Prefetch Abort can be analyzed by reading the Instruction Fault Status Register (IFSR), the Instruction Fault Address Register (IFAR), and the Auxiliary Instruction Fault Status Register (AIFSR).
IFAR contains the address where the CPU was trying to fetch an instruction from. The contents of IFAR is always valid for a Prefetch Abort, because all Prefetch Aborts are synchronous. AIFSR records additional information about the nature and location of the fault, for example ATCM or BTCM.
5.2.3.1 Possible Reasons for Prefetch Abort
- Improper MPU setting: If a
permission fault has occurred based on the IFSR status, it is possible that one
of the following conditions has occurred:
- An instruction is being fetched from a location for which “Execute Never” attribute is set.
- The target address read from IFAR has “Device” or “Strongly-Ordered” memory attribute. This implicitly means that these areas do not have executable code.
- ECC Error on the instruction read: ECC error is detected on the instruction reads. The IFAR register provides the address that caused the error to be detected. The auxiliary IFSR indicates source of the ECC error.
- Wrong return address or branch address - Return address being corrupted - Branch address is corrupted
5.2.3.2 Handling Prefetch Abort Exception
- Confirm whether the CPU control is stuck in Prefetch Abort Exception by checking the halt address. If the Offset is 0x0C, it indicates that the control has ended in a Prefetch Abort Handler.
- Check the status from IFSR and IFAR to determine the type of fault and the address leading to the abort.
- In the case of a “permission” fault, find the region in which the address read from the IFAR register falls under. The region can be checked for MPU violations for code area. (Execute Never setting, Strongly-ordered memory...).
5.2.4 Undefined Instruction
Undefined instruction exception can occur if the CPU does not understand the fetched instruction. There are no Fault Status and Fault address registers associated with this exception; only Link register (R14) provides relevant information. The instruction that caused the UNDEF abort is at R14– 4.
5.2.4.1 Possible Reasons for Undefined Instruction Exception
- Branch to RAM code that has been corrupted or not yet initialized with required functions
- Return address on the stack has been corrupted (for example, stack overflow or pop/push count mismatch)
- Function pointer is not initialized or corrupted
5.2.4.2 Handling Undefined Instruction Exception
- Confirm whether the CPU control is stuck in an Undefined Instruction exception by checking the halt address. If the address is 0x04, then the control has ended in an Undefined Instruction Exception.
- Check the value of the R14 register. R14 – 4 provides the address of the instruction that caused the undefined instruction exception. “X” depends on the mode (X=4 for ARM mode, and X=2 for Thumb mode).
- Check the instruction at the
address read from R14 - X.
- If it is a valid instruction, check whether the mode used (ARM or THUMB) for execution is correct (A mode mismatch for a valid instruction can cause undefined instruction exception).
- If the instruction is invalid, check for address corruption or RAM corruption.
5.3 Fetching Core Registers Inside an Abort Handler
It is very useful to fetch core registers whenever an abort handler occurs. By analyzing the core registers, you can better understand what caused the abort handler. Below is an example of fetching the relevant registers whenever a data abort occurs. For this example, the "empty" project was used from the SDK.
By looking at the vector table that is located at HwiP_armv7r_vectors_nortos_asm.s file, you can see that all data aborts go to HwiP_data_abort_handler. This handler is a C function that is defined in HwiP_armv7r_handlers_nortos.c file.
In our SDK, abort handlers are written in C code. For every C function, the compiler creates prologue and epilogue sequences that manipulate some of the core registers (Stack Pointer register). Thus, if you fetch the Stack Pointer inside the C function, a wrong value will be stored. To avoid that, you must use the "naked" attribute and write a naked function in assembly. This attribute tells the compiler that the function is an embedded assembly function, and then prologue and epilogue sequences is not generated for that function by the compiler, and the Stack Pointer will point to the right value.
Inside HwiP_armv7r_handlers_nortos.c, a few modifications are done:
- Change HwiP_data_abort_handler to be a naked function.
- Create a new C handler (HwiP_data_abort_handler_c) that will be called from the naked function.
volatile uint32_t lrVal, pcVal, spVal;

__attribute__((naked)) void HwiP_data_abort_handler(void)
{
    //When data abort occurs, the processor first halts here

    /* Store Core Registers */
    __asm volatile ( "mov %0, lr" : "=r" ( lrVal ) );
    __asm volatile ( "mov %0, pc" : "=r" ( pcVal ) );
    __asm volatile ( "mov %0, sp" : "=r" ( spVal ) );


    /* Call the C version of the abort handler */
    __asm ("B HwiP_data_abort_handler_c");
}


void __attribute__((interrupt("ABORT"), section(".text.hwi"))) HwiP_data_abort_handler_c(uint32_t *pMSP)
{
    printf("\nLR(r14): %x, PC:%x, SP:%x\n" lrVal, pcVal, spVal);

    volatile uint32_t loop = 1;
    while(loop)
        ;
}In order to test our code, a data fault inside empty_main() was generated by forcing the processor to write to an undefined memory region (writing 0x12 to pMem variable):
void empty_main(void *args)
{
    volatile uint32_t lrVal, pcVal, spVal;
    /* Open drivers to open the UART driver for console */
    Drivers_open();
    Board_driversOpen();

    volatile uint32_t* pMem;
    pMem = 0xFFFFFFFFF;
    *pMem = 0x12;

    while(1);

    Board_driversClose();
    Drivers_close();
}
Once this code was compiled and executed, a data fault is generated and makes the processor to first go through our naked function, store the core registers, call the C function and print the registers to the console.
6 Debugging Arm Cortex-M4 Exceptions
Arm Cortex M series have two types of exceptions:
- System Exceptions - Internally to the processor and generated by the processor itself. There are in total 15 system exceptions that are defined by Arm and supported by the Cortex-M processors.
- Interrupts - External to the core itself. Those interrupts are usually vendor specific and they are routed to the Nested Vectored Interrupt Controller (NVIC), that is responsible for their configuration. The M4F core of the Sitara 24X devices supports up to 64 interrupts. Using NVIC registers you can Enable / Disable / Pend various interrupts and read the status of the active and pending interrupts.
6.1 Exception Entry and Exit Sequence
6.1.1 Entry Sequence
Whenever there is an interrupt:
- Pending bit set - the according pending bit of the interrupt will be set on the register of the NVIC
- Stacking and Vector Fetch (Push xPSR, PC, LR, R12, R3, R2, R1, R0)
- The processor makes an entry into the handler (Active bit is set inside NVIC register)
- Clearing the pending bit of the NVIC register
- The processor mode is changed from Thread to Handler mode
- Handler code is executed
- The MSP ia used for any stack operations inside Handler mode
6.1.2 Exception Exit Sequence
The exception return mechanism is triggered using a special return address (EXC_RETURN). This address is generated during exception entry and it is stored in the Link Reigster (LR). In example, when the processor is in thread mode and the processor uses the Processor Stack Pointer (PSP) as its stack pointer, whenever an exception occurs, the processor does the stacking operations mentioned using PSP, and LR register is loaded with the EXC_RETURN. The way exception return happens, is by writing the value LR into the program counter (PC). By writing the LR value into the PC, exception return can be triggered. When that happens, the processor actually does an unstacking operation and comes to a normal execution. The EXC_RETURN is not an actual address, it includes different fields that are decoded by the processor (Stack frame type, return to thread mode or handler mode, return with MSP or PSP and so on...) so that the processor knows to which mode it should return.
6.1.3 Decoding EXC_RETURN Value
| Bits | Descriptions | Values |
|---|---|---|
| 31:28 | EXC_RETURN indicator | 0xF |
| 27:5 | Reserved | 0xEFFFFF |
| 4 | Stack Frame Type | When FPU is not available, this bit is always 1 |
| 3 | Return Mode | 1 = Return to Thread
Mode 0 = Return to Handler Mode |
| 2 | Return Stack | 1 = Return with PSP 0 = Return with MSP |
| 1 | Reserved | 0 |
| 0 | Reserved | 1 |
Figure 6-1 shows the flow of the exit sequence.
 Figure 6-1 Exit Sequence Flow