SBAA558 October 2022 ADS9218 , ADS9219
2 Driving High-Input Impedance SAR
The ADS9218 has a high-input impedance on both the analog input and on the reference input. The device achieves this high impedance using wide bandwidth linear amplifiers. These amplifiers have giga-ohm input impedances so that external driver circuits do not have any significant loading errors. Furthermore, all the SAR switched-capacitor transients are driven by these amplifiers, so that no transients are visible at either the analog input or reference input. For this circuit, the selection of the amplifier used to drive the analog is only bounded by the desired analog performance of the signal chain. In other words, the transients do not need to be considered and the amplifier is selected based on the noise, distortion, and DC characteristics of the amplifier as needed by your application.
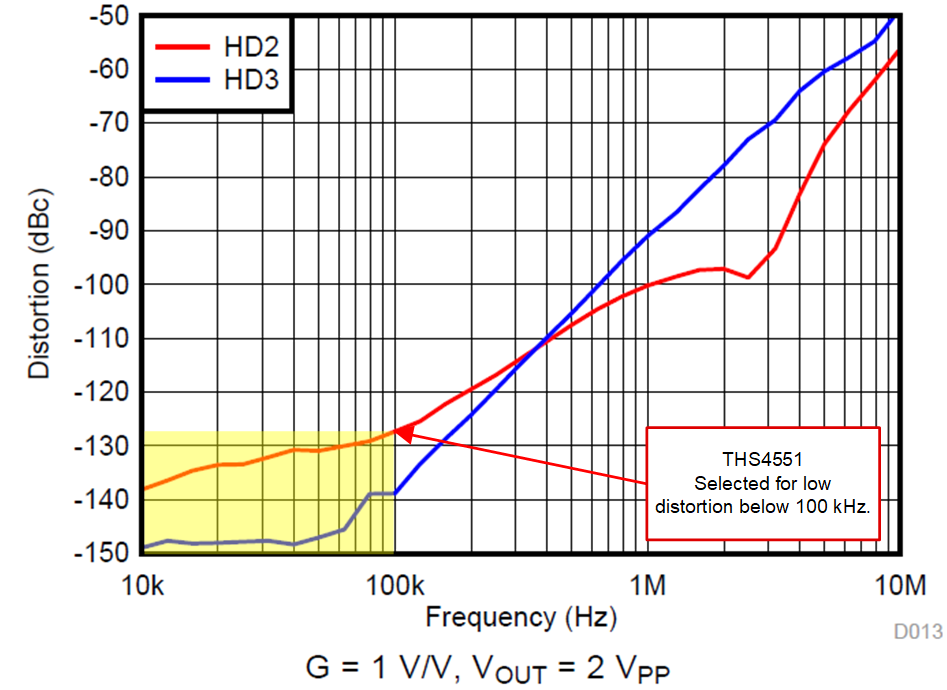
An example signal chain for the ADS9218 optimized for low distortion operation to 100 kHz is shown in Figure 2-1. The THS4551 is used to achieve good distortion performance for signals up to 100 kHz. Note that although the THS4551 has a 150-MHz bandwidth the THD performance begins to fall off above 100 kHz. Higher bandwidth devices consume more power, but have lower distortion at higher frequencies. Table 2-1 compares distortion, and quiescent current for three different FDA options. Note that the devices in this table are suggested for 20-kHz, 100-kHz, and 1-MHz drive options based on the distortion specifications. Also note that the table is given for a 2-VPP signal, but the actual ADC maximum input signal is 6.4 VPP. The increased output swing further increases distortion. The reason the table is given for 2 VPP is that the amplifier data sheets do not all provide distortion specifications for higher output signal levels, so the table provides a comparison of the amplifiers with a common output amplitude. Figure 2-2 illustrates a typical distortion vs frequency curve from the THS4551 data sheet. Since the ADS9218 distortion is –110 dB at 2 kHz, and –101 dB at 1 MHz the amplifier is selected to achieve distortion better than the data converter at high frequency.
| Device | Suggested Max. Freq. for low Distortion |
Amplifier GBW |
Output Filter Bandwidth |
IQ (mA) | HD2 Distortion at Frequency | HD3 Distortion at Frequency |
|---|---|---|---|---|---|---|
| THS4561 | 20 kHz | 60 MHz | 100 kHz | 0.775 | –128 dB at 20 kHz, 2 VPP |
–140 dB at 20 kHz, 2 VPP |
| THS4551 | 100 kHz | 150 MHz | 500 kHz | 1.37 | –128 dB at 100 kHz, 2 VPP | –139 dB at 100 kHz, 2 VPP |
| THS4541 | 1 MHz | 850 MHz | 5 MHz | 9.7 |
–130 dB at 1 MHz, 2 VPP |
–122 dB at 1 MHz, 2 VPP |
 Figure 2-2 Distortion for THS4551 vs
Input Frequency