ZHCSJH0C March   2019  – September 2022 OPA1655 , OPA1656

PRODUCTION DATA  

  1. 特性
  2. 应用
  3. 说明
  4. Revision History
  5. Pin Configuration and Functions
  6. Specifications
    1. 6.1 Absolute Maximum Ratings
    2. 6.2 ESD Ratings
    3. 6.3 Recommended Operating Conditions
    4. 6.4 Thermal Information: OPA1655
    5. 6.5 Thermal Information: OPA1656
    6. 6.6 Electrical Characteristics
    7. 6.7 Typical Characteristics
  7. Detailed Description
    1. 7.1 Overview
    2. 7.2 Functional Block Diagram
    3. 7.3 Feature Description
      1. 7.3.1 Phase Reversal Protection
      2. 7.3.2 Electrical Overstress
      3. 7.3.3 EMI Rejection Ratio (EMIRR)
        1. 7.3.3.1 EMIRR IN+ Test Configuration
    4. 7.4 Device Functional Modes
  8. Application and Implementation
    1. 8.1 Application Information
      1. 8.1.1 Basic Noise Calculations
    2. 8.2 Typical Applications
      1. 8.2.1 Preamplifier Circuit for Vinyl Record Playback With Moving-Magnet Phono Cartridges
        1. 8.2.1.1 Design Requirements
        2. 8.2.1.2 Detailed Design Procedure
        3. 8.2.1.3 Application Curves
      2. 8.2.2 Composite Headphone Amplifier
        1. 8.2.2.1 Application Curves
      3. 8.2.3 Baxandall Tone Control
        1. 8.2.3.1 Application Curves
      4. 8.2.4 Guitar Input to XLR Output
        1. 8.2.4.1 Application Curves
    3. 8.3 Power Supply Recommendations
    4. 8.4 Layout
      1. 8.4.1 Layout Guidelines
        1. 8.4.1.1 Power Dissipation
      2. 8.4.2 Layout Example
  9. Device and Documentation Support
    1. 9.1 Device Support
      1. 9.1.1 Development Support
        1. 9.1.1.1 PSpice® for TI
        2. 9.1.1.2 TINA-TI™ Simulation Software (Free Download)
        3. 9.1.1.3 DIP-Adapter-EVM
        4. 9.1.1.4 DIYAMP-EVM
        5. 9.1.1.5 TI Reference Designs
        6. 9.1.1.6 Filter Design Tool
    2. 9.2 Documentation Support
      1. 9.2.1 Related Documentation
    3. 9.3 接收文档更新通知
    4. 9.4 支持资源
    5. 9.5 Trademarks
    6. 9.6 Electrostatic Discharge Caution
    7. 9.7 术语表
  10. 10Mechanical, Packaging, and Orderable Information

封装选项

机械数据 (封装 | 引脚)
散热焊盘机械数据 (封装 | 引脚)
订购信息

Application Curves

The deviation from the ideal RIAA transfer function curve is shown in Figure 8-4 and normalized to an ideal gain of 40 dB at 1 kHz. The measured gain at 1 kHz is 0.05 dB less than the design goal, and the maximum deviation from 100 Hz to 20 kHz is 0.18 dB. The deviation from the ideal curve can be improved by hand-sorting resistor and capacitor values to their ideal values. The value of C4 can also be increased to reduce the deviation at low frequency.

A spectrum of the preamplifier output signal is shown in Figure 8-5 for a 10 mVRMS, 1-kHz input signal (1-VRMS output). All distortion harmonics are below the preamplifier noise floor.
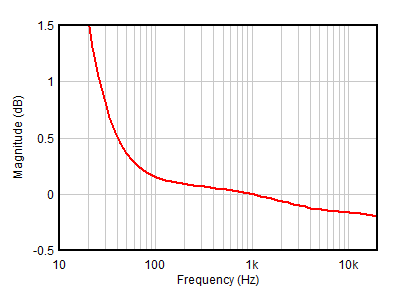
GUID-E50CEE80-4DF8-4B4F-8B1D-75E76E18EC7F-low.gifFigure 8-4 Measured Deviation From Ideal RIAA Response
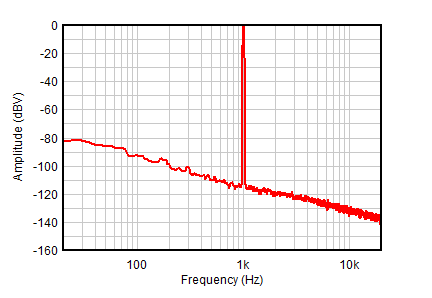
GUID-09942FED-0CE4-4681-B199-E3773B29206D-low.gifFigure 8-5 Output Spectrum for a 10-mVRMS, 1‑kHz Input Signal